APC 2007 Annual Report Download - page 66
Download and view the complete annual report
Please find page 66 of the 2007 APC annual report below. You can navigate through the pages in the report by either clicking on the pages listed below, or by using the keyword search tool below to find specific information within the annual report.-
 1
1 -
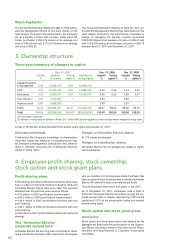
2
-
3
-
4
-
5
-
6
-
7
-
8
-
9
-
10
-
11
-
12
-
13
-
14
-
15
-
16
-
17
-
18
-
19
-
20
-
21
-
22
-
23
-
24
-
25
-
26
-
27
-
28
-
29
-
30
-
31
-
32
-
33
-
34
-
35
-
36
-
37
-
38
-
39
-
40
-
41
-
42
-
43
-
44
-
45
-
46
-
47
-
48
-
49
-
50
-
51
-
52
-
53
-
54
-
55
-
 56
56 -
 57
57 -
 58
58 -
 59
59 -
 60
60 -
 61
61 -
 62
62 -
 63
63 -
 64
64 -
 65
65 -
 66
66 -
 67
67 -
 68
68 -
 69
69 -
 70
70 -
 71
71 -
 72
72 -
 73
73 -
 74
74 -
 75
75 -
 76
76 -
77
-
78
-
79
-
80
-
81
-
82
-
83
-
84
-
85
-
86
-
87
-
88
-
89
-
90
-
91
-
92
-
93
-
94
-
95
-
96
-
97
-
98
-
99
-
100
-
101
-
102
-
103
-
104
-
105
-
106
-
107
-
108
-
109
-
110
-
111
-
112
-
113
-
114
-
115
-
116
-
117
-
118
-
119
-
120
-
121
-
122
-
123
-
124
-
125
-
126
-
127
-
128
-
129
-
130
-
131
-
132
-
133
-
134
-
135
-
136
-
137
-
138
-
139
-
140
-
141
-
142
-
143
-
144
-
145
-
146
-
147
-
148
-
149
-
150
-
151
-
152
-
153
-
154
-
155
-
156
-
157
-
158
-
159
-
160
-
161
-
162
-
163
-
164
-
165
-
166
-
167
-
168
-
169
-
170
-
171
-
172
-
173
-
174
-
175
-
176
-
177
-
178
-
179
-
180
-
181
-
182
-
183
-
184
-
185
-
186
-
187
-
188
-
189
-
190
 |
 |

64
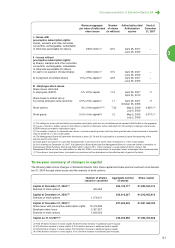
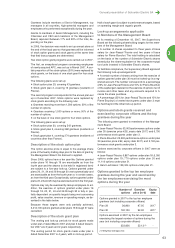
Plan Plan Initial Initial Exercise price Vesting conditions % of Cancelled Options Options Options
no. date number of number of (in ) target options granted to granted to outstanding
grantees options Before After met (1) corporate top 10 at December
capital capital
officers employee 31, 2007
increase increase (2) grantees(2) (3)
16 April 1, 1999 P 337 1,259,300 50.73 50.24 50% - value creation 55.4 245,900 85,600 154,500 0
1999-2001
17 April 1, 1999 P 542 2,123,100 50.73 50.24 100% - 2001 sales, 47.7 1,078,600 107,400 172,900 0
base costs
and operating profit
18 March 24, 2000 P 1,038 1,421,200 65.88 65.24 50% - value creation 0 686,600 63,000 87,900 177,514
2000-2002
19 April 4, 2001 S 1,050 1,557,850 68.80 68.13 None NA NA 205,500 163,600 571,240
20 Dec. 12, 2001 S 180 1,600,000 51.76 51.26 100% - 2004 sales 89.0 166,800 89,000 296,800 345,769
and operating profit
21 Feb. 5, 2003 S 433 2,000,000 45.65 45.21 50% - 2005 operating 84.0 141,900 138,000 322,100 536,557
profit and return
on capital employed
22 Feb. 5, 2003 S 111 111,000 45.65 45.21 None - reserved for NA NA - 10,000 24,631
winners of the
NEW2004 trophies
23 May 6, 2004 S 107 107,000 56.09 55.55 None - reserved for NA NA - 10,000 42,454
winners of the
NEW2004 trophies
24 May 6, 2004 S 402 2,060,700 56.09 55.55 50% - operating margin. 88.9 94,300 141,700 238,600 1,717,509
1/3 per year over 2004,
2005 and 2006
25 May 12, 2005 S 157 138,500 57.02 56.47 None - reserved for NA NA - 15,000 46,856
winners of the
NEW2004 trophies
26 June 28, 2005 S/P 458 2,003,800 60.78 60.19 50% - 2005 and 2006 100 0 200,000 300,000 1,993,764
revenue and
operating margin
27 Dec. 1, 2005 S/P 419 1,614,900 72.10 71.40 50% - 2006 and 2007 100 0 150,000 266,000 1,613,644
revenue and
operating margin
28 Dec. 21, 2006 S/P 489 1,257,120 82.14 81.34 50% - 2007 and 2008 - - 112,000 138,300 1,260,226
revenue and
operating margin
29 April 23, 2007 S/P 43 83,150 97.05 97.05 50% - 2007 and 2008 - - - 36,900 83,150
revenue and
operating margin
30 Dec. 19, 2007 S/P 542 944,926 92.00 92.00 50% - 2008 and 2009 - - 88,200 100,100 944,926
revenue and
operating margin
18,282,546
2 ,414,100 1,380,400 2,312,700 9,358,240
(1) Number of options cancelled because the targets were not met (plans 16 to 26).
(2) Number of options after deducting options cancelled because the targets were not met.
(3) Number of options outstanding after deducting all options cancelled and exercised since the plan’s inception.
S = Options to subscribe new shares. P = Options to purchase existing shares.
Stock option plan details
Number of shares
Grants made in 2007 to the top ten employee grantees
(not including corporate officers)
Plan 2 1,989
Plan 3 8,297
Plan 4 7,637
Stock grants made to the top ten employee grantees during the year