APC 2007 Annual Report Download - page 127
Download and view the complete annual report
Please find page 127 of the 2007 APC annual report below. You can navigate through the pages in the report by either clicking on the pages listed below, or by using the keyword search tool below to find specific information within the annual report.-
 1
1 -
2
-
3
-
4
-
5
-
6
-
7
-
8
-
9
-
10
-
11
-
12
-
13
-
14
-
15
-
16
-
17
-
18
-
19
-
20
-
21
-
22
-
23
-
24
-
25
-
26
-
27
-
28
-
29
-
30
-
31
-
32
-
33
-
34
-
35
-
36
-
37
-
38
-
39
-
40
-
41
-
42
-
43
-
44
-
45
-
46
-
47
-
48
-
49
-
50
-
51
-
52
-
53
-
54
-
55
-
56
-
57
-
58
-
59
-
60
-
61
-
62
-
63
-
64
-
65
-
66
-
67
-
68
-
69
-
70
-
71
-
72
-
73
-
74
-
75
-
76
-
77
-
78
-
79
-
80
-
81
-
82
-
83
-
84
-
85
-
86
-
87
-
88
-
89
-
90
-
91
-
92
-
93
-
94
-
95
-
96
-
97
-
98
-
99
-
100
-
101
-
102
-
103
-
104
-
105
-
106
-
107
-
108
-
109
-
110
-
111
-
112
-
113
-
114
-
115
-
116
-
 117
117 -
 118
118 -
 119
119 -
 120
120 -
 121
121 -
 122
122 -
 123
123 -
 124
124 -
 125
125 -
 126
126 -
 127
127 -
 128
128 -
 129
129 -
 130
130 -
 131
131 -
 132
132 -
 133
133 -
 134
134 -
 135
135 -
 136
136 -
 137
137 -
138
-
139
-
140
-
141
-
142
-
143
-
144
-
145
-
146
-
147
-
148
-
149
-
150
-
151
-
152
-
153
-
154
-
155
-
156
-
157
-
158
-
159
-
160
-
161
-
162
-
163
-
164
-
165
-
166
-
167
-
168
-
169
-
170
-
171
-
172
-
173
-
174
-
175
-
176
-
177
-
178
-
179
-
180
-
181
-
182
-
183
-
184
-
185
-
186
-
187
-
188
-
189
-
190
 |
 |

5
Consolidated financial statements at December 31, 2007
Dec. 31, 2007 Dec. 31, 2006
Capital Number Voting Number Capital Voting
% of shares rights of voting % rights
% rights %
Capital Research and
Management Company 5.40 13,246,418 5.03 13,246,418 --
CDC 4.37 10,707,725 5.27 13,882,725 4.42 5.36
Employees 3.32 8,150,371 5.07 13,355,873 3.09 5.22
Own shares (1) 0.93 2,276,857 - - 0.94 -
Treasury stock 1.66 4,068,200 - - 2.08 -
Public 84.33 206,855,351 82.23 216,663,733 89.47 86.65
Total 100.00 245,299,366 100.00 (2) 263,493,806 (2) 100.00 100.00
(1) Held through Cofibel/Cofimines.
(2) Number of voting rights as defined in Article 223-1 of the AMF general regulations, which includes shares stripped
of voting rights.
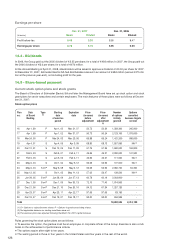
14.2 - Ownership structure
Dec. 31, 2007 Dec. 31, 2006
(in millions of shares)
Basic Diluted Basic Diluted
Common shares* 233,671 233,671 220,003 220,003
Stock options - 2,472 - 2,094
Average weighted number of shares 233,671 236,143 220,003 222,097
*Net of treasury stock and own shares.
No shareholders’ pact was in effect as of December 31, 2007.
14.3 - Earnings per share
Determination of the share base used in calculation
Cumulative Total
number of shares (in )
Capital at Dec. 31, 2006 227,698,348 1,821,586,784
Exercise of stock options 1,820,222 14,561,776
Issuance of shares 13,412,969 107,303,752
Employee share issue 2,367,827 18,942,616
Capital at Dec. 31, 2007 245,299,366 1,962,394,928
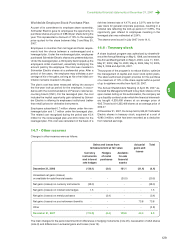
Schneider Electric’s capital management strategy is designed to ensure liquidity, optimize the financial structure and the
weighted average cost of capital, and ensure access to capital markets under the best possible conditions. Decisions may
be based on Earnings Per Share, rating or balance sheet targets. Their implementation may depend on specific market
conditions.
Changes in share capital
Changes in share capital since December 31, 2006 were as follows:
The share premium account increased by 1,133,304,516 following the exercise of options and increases in capital.
125