APC 2007 Annual Report Download - page 172
Download and view the complete annual report
Please find page 172 of the 2007 APC annual report below. You can navigate through the pages in the report by either clicking on the pages listed below, or by using the keyword search tool below to find specific information within the annual report.-
 1
1 -
2
-
3
-
4
-
5
-
6
-
7
-
8
-
9
-
10
-
11
-
12
-
13
-
14
-
15
-
16
-
17
-
18
-
19
-
20
-
21
-
22
-
23
-
24
-
25
-
26
-
27
-
28
-
29
-
30
-
31
-
32
-
33
-
34
-
35
-
36
-
37
-
38
-
39
-
40
-
41
-
42
-
43
-
44
-
45
-
46
-
47
-
48
-
49
-
50
-
51
-
52
-
53
-
54
-
55
-
56
-
57
-
58
-
59
-
60
-
61
-
62
-
63
-
64
-
65
-
66
-
67
-
68
-
69
-
70
-
71
-
72
-
73
-
74
-
75
-
76
-
77
-
78
-
79
-
80
-
81
-
82
-
83
-
84
-
85
-
86
-
87
-
88
-
89
-
90
-
91
-
92
-
93
-
94
-
95
-
96
-
97
-
98
-
99
-
100
-
101
-
102
-
103
-
104
-
105
-
106
-
107
-
108
-
109
-
110
-
111
-
112
-
113
-
114
-
115
-
116
-
117
-
118
-
119
-
120
-
121
-
122
-
123
-
124
-
125
-
126
-
127
-
128
-
129
-
130
-
131
-
132
-
133
-
134
-
135
-
136
-
137
-
138
-
139
-
140
-
141
-
142
-
143
-
144
-
145
-
146
-
147
-
148
-
149
-
150
-
151
-
152
-
153
-
154
-
155
-
156
-
157
-
158
-
159
-
160
-
161
-
 162
162 -
 163
163 -
 164
164 -
 165
165 -
 166
166 -
 167
167 -
 168
168 -
 169
169 -
 170
170 -
 171
171 -
 172
172 -
 173
173 -
 174
174 -
 175
175 -
 176
176 -
 177
177 -
 178
178 -
 179
179 -
 180
180 -
 181
181 -
 182
182 -
183
-
184
-
185
-
186
-
187
-
188
-
189
-
190
 |
 |

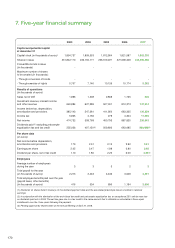
7. Five-year financial summary
2003 2004 2005 2006 2007
Capital and potential capital
at december 31
Capital stock
(in thousands of euros)
1,854,737 1,809,553 1,812,954 1,821,587 1,962,395
Shares in issue 231,842,170 226,194,177 226,619,227 227,698,348 245,299,366
Convertible bonds in issue
(in thousands)
-----
Maximum number of shares
to be created
(in thousands)
:
- Through conversion of bonds - - - - -
- Through exercise of rights 5,707 7,140 10,126 10,174 9,382
Results of operations
(in thousands of euros)
Sales net of VAT 1,896 1,208 2,868 1,735 946
Investment revenue, interest income
and other revenue 640,884 627,389 507,001 812,373 747,914
Income before tax, depreciation,
amortization and provisions 395,143 547,381 411,950 683,335 136,259
Income tax 5,835 4,156 278 4,304 11,099
Net income 474,732 558,768 450,793 887,825 226,643
Dividends paid (1) excluding
précompte
equalization tax and tax credit 255,026 407,150(2) 509,893 683,095 809,488(3)
Per share data
(in euros)
Net income before depreciation,
amortization and provisions 1.79 2.51 2.12 3.92 0.51
Earnings per share 2.05 2.47 1.99 3.90 0.92
Dividend per share, net of tax credit 1.10 1.80 2.25 3.00 3.30(3)
Employees
Average number of employees
during the year 3 3 3 2 2
Total payroll for the year
(in thousands of euros)
2,213 2,443 4,446 3,648 4,291
Total employee benefits paid over the year
(payroll taxes, other benefits)
(in thousands of euros)
416 534 690 1,194 2,606
(1) Dividends on shares held in treasury on the dividend payment date and the associated précompte tax are credited to retained
earnings.
(2) In conjunction with the elimination of the avoir fiscal tax credit and précompte equalization tax, an exceptional 25% exit tax was due
on dividends paid out in 2005. The exit tax gave rise to a tax credit in the same amount that is utilizable or refundable in three equal
installments over the three years following the payment.
(3) Pending approval by shareholders at the Annual Meeting of April 21, 2008.
170