APC 2007 Annual Report Download - page 164
Download and view the complete annual report
Please find page 164 of the 2007 APC annual report below. You can navigate through the pages in the report by either clicking on the pages listed below, or by using the keyword search tool below to find specific information within the annual report.-
 1
1 -
2
-
3
-
4
-
5
-
6
-
7
-
8
-
9
-
10
-
11
-
12
-
13
-
14
-
15
-
16
-
17
-
18
-
19
-
20
-
21
-
22
-
23
-
24
-
25
-
26
-
27
-
28
-
29
-
30
-
31
-
32
-
33
-
34
-
35
-
36
-
37
-
38
-
39
-
40
-
41
-
42
-
43
-
44
-
45
-
46
-
47
-
48
-
49
-
50
-
51
-
52
-
53
-
54
-
55
-
56
-
57
-
58
-
59
-
60
-
61
-
62
-
63
-
64
-
65
-
66
-
67
-
68
-
69
-
70
-
71
-
72
-
73
-
74
-
75
-
76
-
77
-
78
-
79
-
80
-
81
-
82
-
83
-
84
-
85
-
86
-
87
-
88
-
89
-
90
-
91
-
92
-
93
-
94
-
95
-
96
-
97
-
98
-
99
-
100
-
101
-
102
-
103
-
104
-
105
-
106
-
107
-
108
-
109
-
110
-
111
-
112
-
113
-
114
-
115
-
116
-
117
-
118
-
119
-
120
-
121
-
122
-
123
-
124
-
125
-
126
-
127
-
128
-
129
-
130
-
131
-
132
-
133
-
134
-
135
-
136
-
137
-
138
-
139
-
140
-
141
-
142
-
143
-
144
-
145
-
146
-
147
-
148
-
149
-
150
-
151
-
152
-
153
-
 154
154 -
 155
155 -
 156
156 -
 157
157 -
 158
158 -
 159
159 -
 160
160 -
 161
161 -
 162
162 -
 163
163 -
 164
164 -
 165
165 -
 166
166 -
 167
167 -
 168
168 -
 169
169 -
 170
170 -
 171
171 -
 172
172 -
 173
173 -
 174
174 -
175
-
176
-
177
-
178
-
179
-
180
-
181
-
182
-
183
-
184
-
185
-
186
-
187
-
188
-
189
-
190
 |
 |

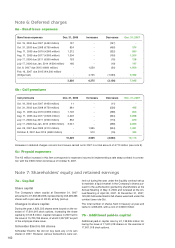
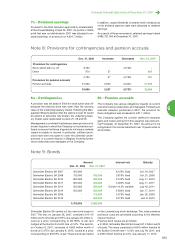
Note 6: Deferred charges
6a - Bond issue expenses
6b - Call premiums
Increases in deferred charges concern bond issues carried out in 2007 in a total amount of 710 million (see note 9).
6c- Prepaid expenses
The 2 million increase in this item corresponds to expenses incurred in implementing a rate swap contract in connec-
tion with the 600 million bond issue of October 8, 2007.
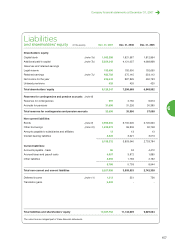
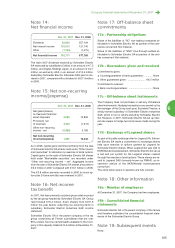
Note 7: Shareholders’ equity and retained earnings
7a - Capital
Share capital
The Company's share capital at December 31, 2007
amounted to 1,962,394,928, represented by 245,299,366
shares with a par value of 8.00, all fully paid up.
Changes in share capital
During the year, 1,820,222 shares were issued on the ex-
ercise of 17,601,018 stock options, increasing the share
capital by 140.8 million. Capital increases in 2007 led to
the issue of 15,780,796 shares, of which 2,367,827 as part
of the employee share issue.
Schneider Electric SA shares
Schneider Electric SA did not buy back any of its own
shares in 2007. However, various transactions were car-
ried out during the year under the liquidity contract set up
to maintain a liquid market in the Company’s shares pur-
suant to the authorization granted by shareholders at the
Annual Meeting of May 3, 2006 and renewed at the An-
nual Meeting of April 26, 2007. At December 31, 2007,
120,000 Schneider Electric SA shares were held under this
contract (see note 2b).
The total number of shares held in treasury at year-end
came to 4,068,200, with a cost of 228.9 million.
7b - Additional paid-in capital
Additional paid-in capital rose by 1,133,305 million fol-
lowing the issue of 17,601,018 shares on the exercise of
17,601,018 stock options.
Bond issue expenses Dec. 31, 2006 Increases Decreases Dec. 31, 2007
Oct. 19, 2000 due 2007 (450 million) 167 - (167) -
Oct. 31, 2003 due 2008 (750 million) 824 - (450) 374
Aug. 11, 2005 due 2010 (900 million) 1,212 - (322) 890
Aug. 11, 2005 due 2017 (600 million) 1,304 - (100) 1,204
July 17, 2006 due 2011 (500 million) 153 - (15) 138
July 17, 2006 due Jan. 2014 (500 million) 166 - (19) 147
Oct. 8, 2007 due 2015 (600 million) - 1,550 (50) 1,500
Feb. 16, 2007 due 2015 (4,500 million)
(bridge loan) - 4,725 (1,033) 3,692
3,826 6,275 (2,156) 7,945
Call premiums Dec. 31, 2006 Increases Decreases Dec. 31, 2007
Oct. 19, 2000 due 2007 (450 million) 11 - (11) -
Oct. 31, 2003 due 2008 (750 million) 981 - (536) 445
Aug. 11, 2005 due 2010 (900 million) 1,122 - (298) 824
Aug. 11, 2005 due 2017 (600 million) 4,222 - (324) 3,898
July 17, 2006 due 2011 (500 million) 852 - (173) 679
July 17, 2006 due Jan. 2014 (500 million) 3,041 - (358) 2,683
Jan. 26, 2007 due 2009 (110 million) - 1,995 (904) 1,091
October 8, 2007 due 2015 (600 million) - 510 (16) 494
10,229 2,505 (2,620) 10,114
162