APC 2007 Annual Report Download - page 137
Download and view the complete annual report
Please find page 137 of the 2007 APC annual report below. You can navigate through the pages in the report by either clicking on the pages listed below, or by using the keyword search tool below to find specific information within the annual report.-
 1
1 -
2
-
3
-
4
-
5
-
6
-
7
-
8
-
9
-
10
-
11
-
12
-
13
-
14
-
15
-
16
-
17
-
18
-
19
-
20
-
21
-
22
-
23
-
24
-
25
-
26
-
27
-
28
-
29
-
30
-
31
-
32
-
33
-
34
-
35
-
36
-
37
-
38
-
39
-
40
-
41
-
42
-
43
-
44
-
45
-
46
-
47
-
48
-
49
-
50
-
51
-
52
-
53
-
54
-
55
-
56
-
57
-
58
-
59
-
60
-
61
-
62
-
63
-
64
-
65
-
66
-
67
-
68
-
69
-
70
-
71
-
72
-
73
-
74
-
75
-
76
-
77
-
78
-
79
-
80
-
81
-
82
-
83
-
84
-
85
-
86
-
87
-
88
-
89
-
90
-
91
-
92
-
93
-
94
-
95
-
96
-
97
-
98
-
99
-
100
-
101
-
102
-
103
-
104
-
105
-
106
-
107
-
108
-
109
-
110
-
111
-
112
-
113
-
114
-
115
-
116
-
117
-
118
-
119
-
120
-
121
-
122
-
123
-
124
-
125
-
126
-
 127
127 -
 128
128 -
 129
129 -
 130
130 -
 131
131 -
 132
132 -
 133
133 -
 134
134 -
 135
135 -
 136
136 -
 137
137 -
 138
138 -
 139
139 -
 140
140 -
 141
141 -
 142
142 -
 143
143 -
 144
144 -
 145
145 -
 146
146 -
 147
147 -
148
-
149
-
150
-
151
-
152
-
153
-
154
-
155
-
156
-
157
-
158
-
159
-
160
-
161
-
162
-
163
-
164
-
165
-
166
-
167
-
168
-
169
-
170
-
171
-
172
-
173
-
174
-
175
-
176
-
177
-
178
-
179
-
180
-
181
-
182
-
183
-
184
-
185
-
186
-
187
-
188
-
189
-
190
 |
 |

5
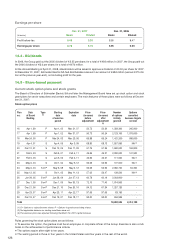
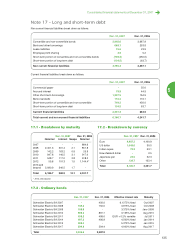
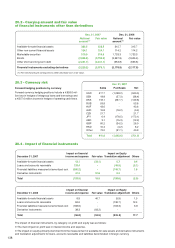
Consolidated financial statements at December 31, 2007
Dec. 31, 2007 Dec. 31, 2006
Nominal Interest Swaps Nominal
2007 - - - 884.6
2008 2,401.3 201.4 2.1 851.8
2009 142.2 163.2 0.9 25.9
2010 947.8 146.5 3.1 917.0
2011 548.7 117.0 2.8 518.0
2012 55.8 101.3 1.5 1,144.4*
2013 and
beyond 2,090.9 240.5 1.7 -
Total 6,186.7 969.9 12.1 4,341.7
* 2012 and beyond.
17.1 - Breakdown by maturity
Dec. 31, 2007 Dec. 31, 2006
Euro 4,907.3 4,100.9
US dollar 1,049.0 30.5
Indian rupee 72.2 53.1
New Zealand dollar - 2.5
Japanese yen 23.5 22.3
Other 134.7 132.4
Total 6,186.7 4,341.7
17.2 - Breakdown by currency
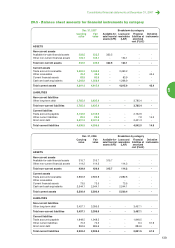
17.3 - Ordinary bonds
Dec. 31, 2007 Dec. 31, 2006 Effective interest rate Maturity
Schneider Electric SA 2007 - 450.0 6.1275% fixed Oct 2007
Schneider Electric SA 2008 749.2 750.0 3.875% fixed Oct 2008
Schneider Electric SA 2009 108.9 - 3.375% fixed Janv 2009
Schneider Electric SA 2010 898.3 897.7 3.125% fixed Aug 2010
Schneider Electric SA 2011 499.2 499.0 EUR + 0.2% variable Jul 2011
Schneider Electric SA 2014 497.2 496.8 4.500% fixed Jan 2014
Schneider Electric SA 2015 598.0 - 5.375% fixed Jan 2015
Schneider Electric SA 2017 594.8 594.4 4.000% fixed Aug 2017
Total 3,945.6 3,687.9
Dec. 31, 2007 Dec. 31, 2006
Convertible and non-convertible bonds 3,945.6 3,687.9
Bank and other borrowings 669.1 253.8
Lease liabilities 19.6 23.9
Employee profit sharing 4.8 5.2
Short-term portion of convertible and non-convertible bonds (749.2) (450.0)
Short-term portion of long-term debt (104.5) (63.7)
Non current financial liabilities 3,785.4 3,457.1
Dec. 31, 2007 Dec. 31, 2006
Commercial paper - 55.0
Accrued interest 79.9 44.9
Other short-term borrowings 1,357.5 154.9
Bank overdrafts 110.2 116.1
Short-term portion of convertible and non-convertible 749.2 450.0
Short-term portion of long-term debt 104.5 63.7
Current financial liabilities 2,401.3 884.6
Total current and non current financial liabilities 6,186.7 4,341.7
Note 17 - Long and short-term debt
Non current financial liabilities break down as follows:
Current financial liabilities break down as follows:
135