APC 2007 Annual Report Download - page 82
Download and view the complete annual report
Please find page 82 of the 2007 APC annual report below. You can navigate through the pages in the report by either clicking on the pages listed below, or by using the keyword search tool below to find specific information within the annual report.-
 1
1 -
2
-
3
-
4
-
5
-
6
-
7
-
8
-
9
-
10
-
11
-
12
-
13
-
14
-
15
-
16
-
17
-
18
-
19
-
20
-
21
-
22
-
23
-
24
-
25
-
26
-
27
-
28
-
29
-
30
-
31
-
32
-
33
-
34
-
35
-
36
-
37
-
38
-
39
-
40
-
41
-
42
-
43
-
44
-
45
-
46
-
47
-
48
-
49
-
50
-
51
-
52
-
53
-
54
-
55
-
56
-
57
-
58
-
59
-
60
-
61
-
62
-
63
-
64
-
65
-
66
-
67
-
68
-
69
-
70
-
71
-
 72
72 -
 73
73 -
 74
74 -
 75
75 -
 76
76 -
 77
77 -
 78
78 -
 79
79 -
 80
80 -
 81
81 -
 82
82 -
 83
83 -
 84
84 -
 85
85 -
 86
86 -
 87
87 -
 88
88 -
 89
89 -
 90
90 -
 91
91 -
 92
92 -
93
-
94
-
95
-
96
-
97
-
98
-
99
-
100
-
101
-
102
-
103
-
104
-
105
-
106
-
107
-
108
-
109
-
110
-
111
-
112
-
113
-
114
-
115
-
116
-
117
-
118
-
119
-
120
-
121
-
122
-
123
-
124
-
125
-
126
-
127
-
128
-
129
-
130
-
131
-
132
-
133
-
134
-
135
-
136
-
137
-
138
-
139
-
140
-
141
-
142
-
143
-
144
-
145
-
146
-
147
-
148
-
149
-
150
-
151
-
152
-
153
-
154
-
155
-
156
-
157
-
158
-
159
-
160
-
161
-
162
-
163
-
164
-
165
-
166
-
167
-
168
-
169
-
170
-
171
-
172
-
173
-
174
-
175
-
176
-
177
-
178
-
179
-
180
-
181
-
182
-
183
-
184
-
185
-
186
-
187
-
188
-
189
-
190
 |
 |

80
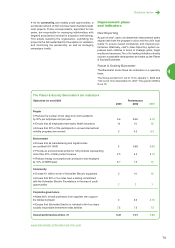
Improvement plans –
Planet & Society Barometer
Health/safety
Reduce the number of lost days from work
accidents by 20% per employee and per year.
2005 2006 2007
Ensure that all employees have basic health
insurance.
2005 2006 2007
Diversity
Ensure that 20% of the participants in annual
international mobility programs are women.
2005 2006 2007
Rating 3/10 4.5/10 5.3/10
Rating 10/10 10/10 10/10
Rating 5.6/10 8.6/10 9.12/10
The most significant improvements during the year con-
cerned the health indicator, product environmental profiles
and suppliers’ commitment to the Global Compact.
Although the total number of certified sites reached a
record high, the ISO 14001 indicator declined in 2007 due
to the consolidation of several new subsidiaries.
Consolidation
All of the quantitative data, with the exception of the
Barometer indicators provided in this section, have been
consolidated using two Group-wide methods.
Social data: A global human resources scorecard, es-
tablished annually over the past eight years based on a
bottom-up reporting process.
Environmental data: Reporting tables from the Group
Environmental Affairs department, based on an annual
manufacturing site survey.
This data is then reconciled with information from ac-
counting and purchasing reporting systems to ensure con-
sistency.
All Group units are included, except in specific identified
cases.
Audit
Independent audit firm Ernst & Young verifies 17 environ-
mental, health & safety and societal indicators for the
Group. The firm’s analysis showed that the definitions,
measurement procedures and data collection method
used by Schneider Electric are meaningful, exhaustive,
neutral and clear. In 2008, Schneider Electric will focus on
giving a more precise description of the procedures for im-
plementing internal indicator monitoring at intermediary
sites and units (see page 100 for Ernst & Young’s conclu-
sions on indicator reliability).
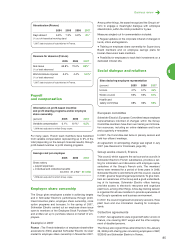
A responsible
corporate citizen
In devising its strategy, Schneider Electric constantly in-
cludes improvement targets for business, social and envi-
ronmental performance and sets up indicators to measure
its achievements objectively, as well as areas for further
progress. The Group demonstrates day in, day out that
business, environmental, societal and social interests all
converge.
Action plans to consume less and more efficiently are chal-
lenging Schneider Electric and its customers to signifi-
cantly improve the energy efficiency of production
processes and infrastructure and, more generally to re-
duce the environmental impact of CO2emissions gener-
ated by industrial and human activity.
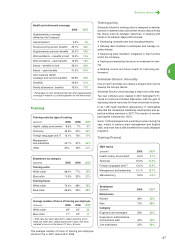
Social performance
Schneider Electric’s people are critical to its success. The
Group motivates its employees and promotes involvement
by making the most of diversity, supporting professional
development, and ensuring safe, healthy working condi-
tions.
Framework
Scope of social data consolidation
Global scope
All data published in the following section covers the
Group’s global scope (including APC).
All workforce data excludes temporary employees, except
for the average workforce figure.
> Consolidated units:
Corporate Functions, Operating Divisions and Business
Units (for all data).
Pelco, ETTS, Atos, Ritto, Grant and Northern for work-
force data only.
> Non-consolidated units:
Companies that are less than 51%-owned by Schneider
Electric.
Senior Management for compensation data.
France
Certain data concern France and cover more than 80% of
the workforce in France. In this case, they are flagged as
“French data”.