APC 2007 Annual Report Download - page 166
Download and view the complete annual report
Please find page 166 of the 2007 APC annual report below. You can navigate through the pages in the report by either clicking on the pages listed below, or by using the keyword search tool below to find specific information within the annual report.-
 1
1 -
2
-
3
-
4
-
5
-
6
-
7
-
8
-
9
-
10
-
11
-
12
-
13
-
14
-
15
-
16
-
17
-
18
-
19
-
20
-
21
-
22
-
23
-
24
-
25
-
26
-
27
-
28
-
29
-
30
-
31
-
32
-
33
-
34
-
35
-
36
-
37
-
38
-
39
-
40
-
41
-
42
-
43
-
44
-
45
-
46
-
47
-
48
-
49
-
50
-
51
-
52
-
53
-
54
-
55
-
56
-
57
-
58
-
59
-
60
-
61
-
62
-
63
-
64
-
65
-
66
-
67
-
68
-
69
-
70
-
71
-
72
-
73
-
74
-
75
-
76
-
77
-
78
-
79
-
80
-
81
-
82
-
83
-
84
-
85
-
86
-
87
-
88
-
89
-
90
-
91
-
92
-
93
-
94
-
95
-
96
-
97
-
98
-
99
-
100
-
101
-
102
-
103
-
104
-
105
-
106
-
107
-
108
-
109
-
110
-
111
-
112
-
113
-
114
-
115
-
116
-
117
-
118
-
119
-
120
-
121
-
122
-
123
-
124
-
125
-
126
-
127
-
128
-
129
-
130
-
131
-
132
-
133
-
134
-
135
-
136
-
137
-
138
-
139
-
140
-
141
-
142
-
143
-
144
-
145
-
146
-
147
-
148
-
149
-
150
-
151
-
152
-
153
-
154
-
155
-
 156
156 -
 157
157 -
 158
158 -
 159
159 -
 160
160 -
 161
161 -
 162
162 -
 163
163 -
 164
164 -
 165
165 -
 166
166 -
 167
167 -
 168
168 -
 169
169 -
 170
170 -
 171
171 -
 172
172 -
 173
173 -
 174
174 -
 175
175 -
 176
176 -
177
-
178
-
179
-
180
-
181
-
182
-
183
-
184
-
185
-
186
-
187
-
188
-
189
-
190
 |
 |

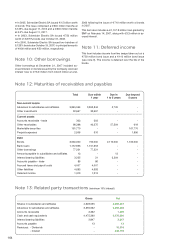
Note 12: Maturities of receivables and payables
Total Due within Due in Due beyond
1 year 1 to 5 years 5 years
Non-current assets
Advances to subsidiaries and affiliates 3,855,564 3,852,844 2,720 -
Other investments 32,667 32,667 - -
Current assets
Accounts receivable - trade 303 303 - -
Other receivables 98,398 40,275 57,504 619
Marketable securities 161,770 - - 161,770
Prepaid expenses 2,506 516 - 1,990
Debt
Bonds 3,960,000 750,000 2,110,000 1,100,000
Bank loans 1,157,853 1,157,853 - -
Other borrowings 77,221 77,221 - -
Amounts payable to subsidiaries and affiliates 13 - 13 -
Interest bearing liabilities 3,225 21 3,204 -
Accounts payable - trade 86 86 - -
Accrued taxes and payroll costs 4,007 4,007 - -
Other liabilities 4,693 4,693 - -
Deferred income 1,313 1,313 - -
Note 13: Related party transactions
(minimum 10% interest)
Gross Net
Shares in subsidiaries and affiliates 4,628,055 4,589,437
Advances to subsidiaries and affiliates 3,855,562 3,855,398
Accounts receivable 2,332 1,399
Cash and cash equivalents 4,475,390 4,475,390
Interest bearing liabilities 2,847 2,847
Accounts payable 13 13
Revenues: - Dividends - 10,516
- Interest - 345,178
In 2005, Schneider Electric SA issued 1.5 billion worth
of bonds. The issue comprised a 900 million tranche at
3.125% due August 11, 2010 and a 600 million tranche
at 4.0% due August 11, 2017.
In 2003, Schneider Electric SA issued 750 million
worth of 3.875% bonds due October 31, 2008.
In 2000, Schneider Electric SA issued two tranches of
6.125% bonds due October 19, 2007, in principal amounts
of 400 million and 50 million, respectively.
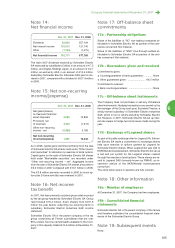
Note 10: Other borrowings
Other borrowings at December 31, 2007 included ac-
crued interest on bonds issued by the Company. Accrued
interest rose to 73.9 million from 44.8 million at end-
2006 following the issue of 710 million worth of bonds
in 2007.
This item also includes a 1,157.8 million loan granted by
BNP on February 14, 2007, along with 3.3 million in ac-
crued interest.
Note 11: Deferred income
This item includes income from two swaps taken out on a
750 million bond issue and a 110 million bond issue
(see note 9). The income is deferred over the life of the
bonds.
164