APC 2007 Annual Report Download - page 123
Download and view the complete annual report
Please find page 123 of the 2007 APC annual report below. You can navigate through the pages in the report by either clicking on the pages listed below, or by using the keyword search tool below to find specific information within the annual report.-
 1
1 -
2
-
3
-
4
-
5
-
6
-
7
-
8
-
9
-
10
-
11
-
12
-
13
-
14
-
15
-
16
-
17
-
18
-
19
-
20
-
21
-
22
-
23
-
24
-
25
-
26
-
27
-
28
-
29
-
30
-
31
-
32
-
33
-
34
-
35
-
36
-
37
-
38
-
39
-
40
-
41
-
42
-
43
-
44
-
45
-
46
-
47
-
48
-
49
-
50
-
51
-
52
-
53
-
54
-
55
-
56
-
57
-
58
-
59
-
60
-
61
-
62
-
63
-
64
-
65
-
66
-
67
-
68
-
69
-
70
-
71
-
72
-
73
-
74
-
75
-
76
-
77
-
78
-
79
-
80
-
81
-
82
-
83
-
84
-
85
-
86
-
87
-
88
-
89
-
90
-
91
-
92
-
93
-
94
-
95
-
96
-
97
-
98
-
99
-
100
-
101
-
102
-
103
-
104
-
105
-
106
-
107
-
108
-
109
-
110
-
111
-
112
-
 113
113 -
 114
114 -
 115
115 -
 116
116 -
 117
117 -
 118
118 -
 119
119 -
 120
120 -
 121
121 -
 122
122 -
 123
123 -
 124
124 -
 125
125 -
 126
126 -
 127
127 -
 128
128 -
 129
129 -
 130
130 -
 131
131 -
 132
132 -
 133
133 -
134
-
135
-
136
-
137
-
138
-
139
-
140
-
141
-
142
-
143
-
144
-
145
-
146
-
147
-
148
-
149
-
150
-
151
-
152
-
153
-
154
-
155
-
156
-
157
-
158
-
159
-
160
-
161
-
162
-
163
-
164
-
165
-
166
-
167
-
168
-
169
-
170
-
171
-
172
-
173
-
174
-
175
-
176
-
177
-
178
-
179
-
180
-
181
-
182
-
183
-
184
-
185
-
186
-
187
-
188
-
189
-
190
 |
 |

5
Consolidated financial statements at December 31, 2007
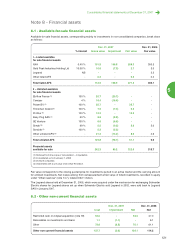
Fair value corresponds to the closing quoted price for investments quoted in an active market and the carrying amount
for unlisted investments. Net losses arising from remeasurement at fair value of listed investments, recorded in equity
under "Other reserves" (note 14.7), totaled 32.1 million.
The Legrand shares held at December 31, 2006, which were acquired under the mechanism for exchanging Schneider
Electric shares for Legrand shares set up when Schneider Electric sold Legrand in 2002, were sold back to Legrand
SAS in January 2007.
Dec. 31, 2007 Dec. 31, 2006
Cost Impairment Net Net
Restricted cash on Clipsal acquisition (note 18) 54.0 - 54.0 47.0
Receivables on investments and loans 1.1 (1.1) - 6.1
Other 72.6 (2.5) 70.1 61.1
Other non current financial assets 127.7 (3.6) 124.1 114.2
8.2 - Other non-current financial assets
Note 8 - Financial assets
8.1 - Available-for-sale financial assets
Available-for-sale financial assets, corresponding mainly to investments in non-consolidated companies, break down
as follows:
Dec. 31, 2007 Dec. 31, 2006
% interest Gross value
Impairment
Fair value Fair value
I – Listed available
for sale financial assets
AXA 0.40 %
101.5 166.8 268.3 300.5
Gold Peak Industries Holding Ltd 10.06 % 10.6 (7.9) 2.7 3.0
Legrand NS - - - 2.2
Other listed AFS - 0.4 - 0.4 0.4
Total listed AFS 112.5 158.9 271.4 306.1
II – Unlisted available
for sale financial assets
Eb@se France (1) 100 % 20.7 (20.7) - -
Comipar 4 %
16.4 (16.4) - -
Polam BV (1) 100 % 25.7 - 25.7 -
Thorsman Ireland (1) 100 % 7.5 (7.3) 0.2 -
Profilux (2) 100 % 12.2 - 12.2 -
Easy Plug SAS (1) 50 % 8.8 (8.8) - -
SE Venture 100 % 6.6 (6.6) - -
Simak (3) 99 % 5.5 (0.5) 5.0 5.0
Senside (1) 100 % 5.2 (5.2) - -
Other unlisted AFS (4) -21.2 (13.2) 8.0 4.6
Total unlisted AFS 129.8 (78.7) 51.1 9.6
Financial assets
available for sale 242.3 80.2 322.5 315.7
(1) Removed from the scope of consolidation – in liquidation.
(2) Consolidated as from January 1, 2008.
(3) Dormant companies.
(4) Investments with a unit value of less than
5 million.
121