APC 2007 Annual Report Download - page 140
Download and view the complete annual report
Please find page 140 of the 2007 APC annual report below. You can navigate through the pages in the report by either clicking on the pages listed below, or by using the keyword search tool below to find specific information within the annual report.-
 1
1 -
2
-
3
-
4
-
5
-
6
-
7
-
8
-
9
-
10
-
11
-
12
-
13
-
14
-
15
-
16
-
17
-
18
-
19
-
20
-
21
-
22
-
23
-
24
-
25
-
26
-
27
-
28
-
29
-
30
-
31
-
32
-
33
-
34
-
35
-
36
-
37
-
38
-
39
-
40
-
41
-
42
-
43
-
44
-
45
-
46
-
47
-
48
-
49
-
50
-
51
-
52
-
53
-
54
-
55
-
56
-
57
-
58
-
59
-
60
-
61
-
62
-
63
-
64
-
65
-
66
-
67
-
68
-
69
-
70
-
71
-
72
-
73
-
74
-
75
-
76
-
77
-
78
-
79
-
80
-
81
-
82
-
83
-
84
-
85
-
86
-
87
-
88
-
89
-
90
-
91
-
92
-
93
-
94
-
95
-
96
-
97
-
98
-
99
-
100
-
101
-
102
-
103
-
104
-
105
-
106
-
107
-
108
-
109
-
110
-
111
-
112
-
113
-
114
-
115
-
116
-
117
-
118
-
119
-
120
-
121
-
122
-
123
-
124
-
125
-
126
-
127
-
128
-
129
-
 130
130 -
 131
131 -
 132
132 -
 133
133 -
 134
134 -
 135
135 -
 136
136 -
 137
137 -
 138
138 -
 139
139 -
 140
140 -
 141
141 -
 142
142 -
 143
143 -
 144
144 -
 145
145 -
 146
146 -
 147
147 -
 148
148 -
 149
149 -
 150
150 -
151
-
152
-
153
-
154
-
155
-
156
-
157
-
158
-
159
-
160
-
161
-
162
-
163
-
164
-
165
-
166
-
167
-
168
-
169
-
170
-
171
-
172
-
173
-
174
-
175
-
176
-
177
-
178
-
179
-
180
-
181
-
182
-
183
-
184
-
185
-
186
-
187
-
188
-
189
-
190
 |
 |

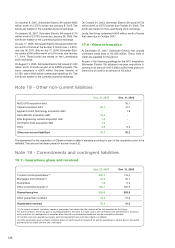
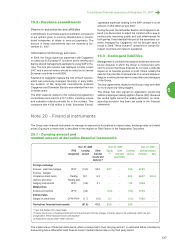
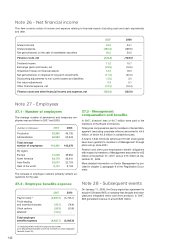
20.2 - Carrying amount and fair value
of financial instruments other than derivatives
Dec. 31, 2007 Dec. 31, 2006
Notional Fair value Notional Fair value
amount (1) amount (1)
Available-for-sale financial assets 322.5 322.5 315.7 315.7
Other non-current financial assets 124.1 124.1 114.2 114.2
Marketable securities 510.9 510.9 1,733.3 1,733.3
Bonds (3,945.6) (3,795.5) (3,687.9) (3,626.4)
Other short and long-term debt (2,241.1) (2,241.1) (653.8) (653.8)
Financial instruments excluding derivatives (5,229.2) (5,079.1) (2,178.5) (2,117.0)
(1) The notional amount corresponds to either amortized cost or fair value.
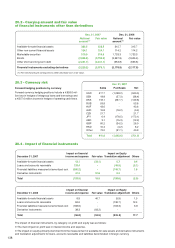
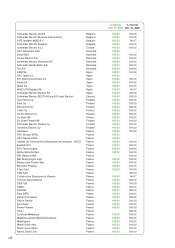
Dec. 31, 2007
Sales Purchases Net
USD 517.7 (1,038.2) (520.5)
SEK 18.8 (57.2) (38.4)
DKK 118.1 (267.7) (149.6)
RUB 53.8 - 53.8
HUF 43.6 - 43.6
AUD 15.8 (16.2) (0.4)
CZK 21.7 - 21.7
JPY 6.4 (178.5) (172.1)
AED 3.1 (15.3) (12.2)
GBP 60.2 (34.2) 26.0
HKD 10.4 (4.2) 6.2
Other 72.0 (31.1) 40.9
Total 941.6 (1,642.6) (701.0)
20.3 - Currency risk
Forward hedging positions by currency
Forward currency hedging positions include a 958.6 mil-
lion loss in hedges of intragroup loans and borrowings and
a 257.6 million income in hedges of operating cash flows.
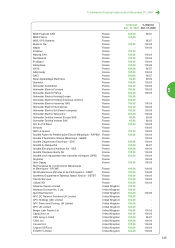
20.4 - Impact of financial instruments
Impact on financial Impact on Equity
December 31, 2007 income and expense Fair value Translation adjustment Others
Available-for-sale financial assets 12.1 (32.1) 0.7 0.4
Loans and accounts receivable 133.4 - (49.9) (5.1)
Financial liabilities measured at amortized cost (380.2) - (149.7) 1.8
Derivative instruments 41.2 51.6 0.3 -
Total (193.5) 19.5 (198.6) (2.9)
Impact on financial Impact on Equity
December 31, 2006 income and expense Fair value Translation adjustment Others
Available-for-sale financial assets 8.9 40.7 (5.9) 1.5
Loans and accounts receivable 84.6 - (136.7) 12.4
Financial liabilities measured at amortized cost (188.6) - (193.3) 3.8
Derivative instruments 38.3 (93.2) - -
Total (56.8) (52.5) (335.9) 17.7
The impact of financial instruments, by category, on profit and equity was as follows:
The main impact on profit was in interest income and expense.
The impact on equity primarily stemmed from the measurement of available-for-sale assets and derivative instruments
and translation adjustments for loans, accounts receivable and liabilities denominated in foreign currency.
138