APC 2007 Annual Report Download - page 144
Download and view the complete annual report
Please find page 144 of the 2007 APC annual report below. You can navigate through the pages in the report by either clicking on the pages listed below, or by using the keyword search tool below to find specific information within the annual report.-
 1
1 -
2
-
3
-
4
-
5
-
6
-
7
-
8
-
9
-
10
-
11
-
12
-
13
-
14
-
15
-
16
-
17
-
18
-
19
-
20
-
21
-
22
-
23
-
24
-
25
-
26
-
27
-
28
-
29
-
30
-
31
-
32
-
33
-
34
-
35
-
36
-
37
-
38
-
39
-
40
-
41
-
42
-
43
-
44
-
45
-
46
-
47
-
48
-
49
-
50
-
51
-
52
-
53
-
54
-
55
-
56
-
57
-
58
-
59
-
60
-
61
-
62
-
63
-
64
-
65
-
66
-
67
-
68
-
69
-
70
-
71
-
72
-
73
-
74
-
75
-
76
-
77
-
78
-
79
-
80
-
81
-
82
-
83
-
84
-
85
-
86
-
87
-
88
-
89
-
90
-
91
-
92
-
93
-
94
-
95
-
96
-
97
-
98
-
99
-
100
-
101
-
102
-
103
-
104
-
105
-
106
-
107
-
108
-
109
-
110
-
111
-
112
-
113
-
114
-
115
-
116
-
117
-
118
-
119
-
120
-
121
-
122
-
123
-
124
-
125
-
126
-
127
-
128
-
129
-
130
-
131
-
132
-
133
-
 134
134 -
 135
135 -
 136
136 -
 137
137 -
 138
138 -
 139
139 -
 140
140 -
 141
141 -
 142
142 -
 143
143 -
 144
144 -
 145
145 -
 146
146 -
 147
147 -
 148
148 -
 149
149 -
 150
150 -
 151
151 -
 152
152 -
 153
153 -
 154
154 -
155
-
156
-
157
-
158
-
159
-
160
-
161
-
162
-
163
-
164
-
165
-
166
-
167
-
168
-
169
-
170
-
171
-
172
-
173
-
174
-
175
-
176
-
177
-
178
-
179
-
180
-
181
-
182
-
183
-
184
-
185
-
186
-
187
-
188
-
189
-
190
 |
 |

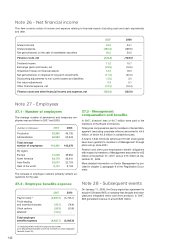
Note 26 - Net financial income
This item consists solely of income and expense relating to financial assets (including cash and cash equivalents)
and debt.
Note 27 - Employees
27.3 - Management
compensation and benefits
In 2007, directors’ fees of 0.7 million were paid to the
members of the Board of Directors.
Total gross compensation paid to members of Senior Man-
agement (excluding corporate officers) amounted to 4.5
million, of which 2.3 million in variable bonuses.
A total of 1,649,100 stock options and 15,301 stock grants
have been granted to members of Management through
plans set up since 2001.
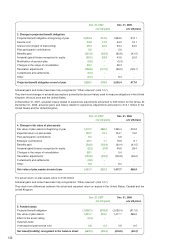
Pension and other post-employment benefit obligations
with respect to members of Management amounted to €65
million at December 31, 2007 versus 73 million at De-
cember 31, 2006.
More detailed information on Senior Management is pro-
vided in chapter 2, paragraph 9 of the Registration Docu-
ment.
Note 28 - Subsequent events
On January 11, 2008, the Group signed an agreement to
acquire US-based IMS, a company that designs and man-
ufactures integrated motor and drive products. In 2007,
IMS generated revenue of around $20 million.
27.1 - Number of employees
The average number of permanent and temporary em-
ployees was as follows in 2007 and 2006:
The increase in employee numbers primarily reflects ac-
quisitions for the year.
2007 2006
Interest income 93.2 34.1
Interest expense (380.2) (188.6)
Net gains/(losses) on the sale of marketable securities 40.2 50.5
Finance costs, net (246.8) (104.0)
Dividend income 11.2 10.7
Exchange gains and losses, net (20.5) (15.5)
Impairment losses on financial assets 12.3 18.2
Net gains/(losses) on disposal of long-term investments (11.4) (20.0)
Discounting adjustments to non-current assets and liabilities (1.0) 2.0
Fair value adjustments 0.3 0.1
Other financial expense, net (10.0) (12.4)
Finance costs and other financial income and expense, net (265.9) (120.9)
(number of employees)
2007 2006
Production 52,360 46,135
Administration 66,980 53,943
Total average
number of employees 119,340 100,078
By region:
Europe 51,046 46,962
North America 28,179 23,610
Asia-Pacific 32,010 22,753
Rest of the world 8,104 6,753
27.2 - Employee benefits expense
2007 2006
Payroll costs (1) (4,505.7) (3,796.7)
Profit-sharing
and incentive bonuses (78.7) (78.4)
Stock options (24.3) (20.8)
WESOP (12.0) -
Total employee
benefits expense (4,620.7) (3,895.9)
(1) Including
46.9 million for pension and other
post-employment benefits and
23.4 million for other employee
benefits (note 15).
142