APC 2007 Annual Report Download - page 78
Download and view the complete annual report
Please find page 78 of the 2007 APC annual report below. You can navigate through the pages in the report by either clicking on the pages listed below, or by using the keyword search tool below to find specific information within the annual report.-
 1
1 -
2
-
3
-
4
-
5
-
6
-
7
-
8
-
9
-
10
-
11
-
12
-
13
-
14
-
15
-
16
-
17
-
18
-
19
-
20
-
21
-
22
-
23
-
24
-
25
-
26
-
27
-
28
-
29
-
30
-
31
-
32
-
33
-
34
-
35
-
36
-
37
-
38
-
39
-
40
-
41
-
42
-
43
-
44
-
45
-
46
-
47
-
48
-
49
-
50
-
51
-
52
-
53
-
54
-
55
-
56
-
57
-
58
-
59
-
60
-
61
-
62
-
63
-
64
-
65
-
66
-
67
-
 68
68 -
 69
69 -
 70
70 -
 71
71 -
 72
72 -
 73
73 -
 74
74 -
 75
75 -
 76
76 -
 77
77 -
 78
78 -
 79
79 -
 80
80 -
 81
81 -
 82
82 -
 83
83 -
 84
84 -
 85
85 -
 86
86 -
 87
87 -
 88
88 -
89
-
90
-
91
-
92
-
93
-
94
-
95
-
96
-
97
-
98
-
99
-
100
-
101
-
102
-
103
-
104
-
105
-
106
-
107
-
108
-
109
-
110
-
111
-
112
-
113
-
114
-
115
-
116
-
117
-
118
-
119
-
120
-
121
-
122
-
123
-
124
-
125
-
126
-
127
-
128
-
129
-
130
-
131
-
132
-
133
-
134
-
135
-
136
-
137
-
138
-
139
-
140
-
141
-
142
-
143
-
144
-
145
-
146
-
147
-
148
-
149
-
150
-
151
-
152
-
153
-
154
-
155
-
156
-
157
-
158
-
159
-
160
-
161
-
162
-
163
-
164
-
165
-
166
-
167
-
168
-
169
-
170
-
171
-
172
-
173
-
174
-
175
-
176
-
177
-
178
-
179
-
180
-
181
-
182
-
183
-
184
-
185
-
186
-
187
-
188
-
189
-
190
 |
 |
76
Other non-current liabilities
Other non-current liabilities totaled 77 million. This pri-
marily included acquisition debt of 15 million for the 50%
interest in Delixi Electric and the amount of the acquisition
price withheld for Clipsal (54 million). This amount is
being held in escrow and is recorded under "Other non-
current financial assets".
Deferred taxes
Deferred tax assets came to 688 million, reflecting un-
used tax losses, in an amount of 226 million, and future
tax savings on provisions for pensions, in an amount of
303 million.
Deferred tax liabilities totaled 910 million and primarily
comprised deferred taxes recognized on trademarks, cus-
tomer lists and patents purchased during acquisitions.
The 589 million change over the year stems primarily
from the recognition of deferred tax liabilities on intangible
assets recognized in connection with the APC business
combination, in an amount of 690 million, and the use of
103 million in tax loss carryforwards.
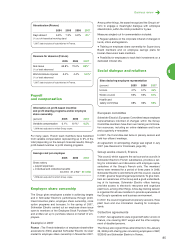
Parent company
financial statements
Schneider Electric SA posted total portfolio revenues of
21 million in 2007 compared with 577 million the previ-
ous year. Interest income amounted to 403 million ver-
sus 255 million the year before. Profit before tax came to
134 million versus 663 million in 2006.
Net profit stood at 227 million versus 888 million in
2006.
Equity before appropriation of net profit amounted to
8,120 million at December 31, 2007 versus 7,299 mil-
lion at the previous year-end, after taking into account 2007
profit, dividend payments of 683 million, and share issues
in an amount of 1,274 million.
Subsidiaries
Schneider Electric Industries SAS
Revenue totaled 3.3 billion versus 3.0 billion in 2006.
Operating profit decreased to 86.7 million from 216.5
million in 2006.
Net profit came to 443 million compared with 863 mil-
lion in 2006.
Cofibel
Cofibel's portfolio consists entirely of Schneider Electric
SA shares.
Profit before tax came to 5.4 million compared with 4.8
million in 2006.
Cofibel posted an after-tax loss of 2.5 million, compared
with an after-tax profit of 4.7 million in 2006.
Cofimines
Profit before tax came to 2.0 million compared with 1.7
million in 2006.
After taking into account corporate income tax, net profit
stood at 1.8 million versus 1.6 million in 2006.
Risk factors
Details on risk factors are provided in paragraph risk fac-
tors of chapter 1 on Description of the Company and its
businesses.
Compensation and benefits
paid to corporate officers
Details on compensation and benefits paid to corporate
officers are provided in paragraph 9 of chapter 2 on Cor-
porate Governance.
4. Outlook for 2008
In the current economic situation, the Group anticipates
the following results for 2008:
Organic revenue growth of between 6% and 8%.
Operating EBITA margin of 15%.