APC 2007 Annual Report Download - page 158
Download and view the complete annual report
Please find page 158 of the 2007 APC annual report below. You can navigate through the pages in the report by either clicking on the pages listed below, or by using the keyword search tool below to find specific information within the annual report.-
 1
1 -
2
-
3
-
4
-
5
-
6
-
7
-
8
-
9
-
10
-
11
-
12
-
13
-
14
-
15
-
16
-
17
-
18
-
19
-
20
-
21
-
22
-
23
-
24
-
25
-
26
-
27
-
28
-
29
-
30
-
31
-
32
-
33
-
34
-
35
-
36
-
37
-
38
-
39
-
40
-
41
-
42
-
43
-
44
-
45
-
46
-
47
-
48
-
49
-
50
-
51
-
52
-
53
-
54
-
55
-
56
-
57
-
58
-
59
-
60
-
61
-
62
-
63
-
64
-
65
-
66
-
67
-
68
-
69
-
70
-
71
-
72
-
73
-
74
-
75
-
76
-
77
-
78
-
79
-
80
-
81
-
82
-
83
-
84
-
85
-
86
-
87
-
88
-
89
-
90
-
91
-
92
-
93
-
94
-
95
-
96
-
97
-
98
-
99
-
100
-
101
-
102
-
103
-
104
-
105
-
106
-
107
-
108
-
109
-
110
-
111
-
112
-
113
-
114
-
115
-
116
-
117
-
118
-
119
-
120
-
121
-
122
-
123
-
124
-
125
-
126
-
127
-
128
-
129
-
130
-
131
-
132
-
133
-
134
-
135
-
136
-
137
-
138
-
139
-
140
-
141
-
142
-
143
-
144
-
145
-
146
-
147
-
 148
148 -
 149
149 -
 150
150 -
 151
151 -
 152
152 -
 153
153 -
 154
154 -
 155
155 -
 156
156 -
 157
157 -
 158
158 -
 159
159 -
 160
160 -
 161
161 -
 162
162 -
 163
163 -
 164
164 -
 165
165 -
 166
166 -
 167
167 -
 168
168 -
169
-
170
-
171
-
172
-
173
-
174
-
175
-
176
-
177
-
178
-
179
-
180
-
181
-
182
-
183
-
184
-
185
-
186
-
187
-
188
-
189
-
190
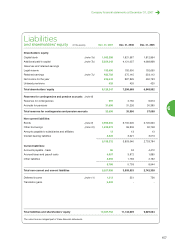
 |
 |

Depreciation Dec. 31, 2007 Dec. 31, 2006 Dec. 31, 2005
Assets (thousands)
amortization
Cost
and provisions
Net Net Net
Non-current assets:
Intangible assets (note 1a)
Intangible rights 27,474 (27,474) 0--
Property, plant and equipment (note 1b)
Land 3,225 - 3,225 3,281 3,444
Buildings 130 (130) ---
Other 1,730 (511) 1,219 1,219 1,203
32,559 (28,115) 4,444 4,500 4,647
Investments
Shares in subsidiaries
and affiliates
(note 2a)
4,629,195 (39,723) 4,589,472 1,779,360 2,014,108
Other investments
(note 2b)
185,443 (16,432) 169,011 194,566 132,835
Advances to subsidiaries
and affiliates
(note 2c)
3,855,564 (164) 3,855,400 2,980,675 2,972,761
Other
(note 2d)
32,667 (0) 32,667 30,200 177,161
8,702,869 (56,319) 8,646,550 4,984,801 5,296,865
Total non-current assets 8,735,428 (84,434) 8,650,994 4,989,301 5,301,512
Current assets:
Accounts receivable
Accounts receivable - trade 303 - 303 193 52
Other
(note 3)
98,398 (46,246) 52,152 304,417 214,626
98,701 (46,246) 52,455 304,610 214,678
Cash and cash equivalents
Marketable securities
(note 4)
161,770 (0) 161,770 169,012 182,262
Advances to the Group cash pool
(note 5)
4,475,389 - 4,475,389 5,666,443 3,917,909
Other 145 - 145 82 22
4,637,304 (0) 4,637,304 5,835,537 4,100,193
Total current assets 4,736,005 (46,246) 4,689,759 6,140,147 4,314,871
Accruals and other assets:
Prepaid expenses
(note 6c)
2,506 - 2,506 496 553
Deferred charges
(note 6a)
7,945 - 7,945 3,826 4,573
Bond call premiums
(note 6b)
10,114 - 10,114 10,229 7,485
Translation losses 6,444 - 6,444 10 10
Total Assets 13,498,442 (130,680) 13,367,762 11,144,009 9,629,004
The notes form an integral part of these financial statements.
1. Balance sheet
156