APC 2007 Annual Report Download - page 136
Download and view the complete annual report
Please find page 136 of the 2007 APC annual report below. You can navigate through the pages in the report by either clicking on the pages listed below, or by using the keyword search tool below to find specific information within the annual report.-
 1
1 -
2
-
3
-
4
-
5
-
6
-
7
-
8
-
9
-
10
-
11
-
12
-
13
-
14
-
15
-
16
-
17
-
18
-
19
-
20
-
21
-
22
-
23
-
24
-
25
-
26
-
27
-
28
-
29
-
30
-
31
-
32
-
33
-
34
-
35
-
36
-
37
-
38
-
39
-
40
-
41
-
42
-
43
-
44
-
45
-
46
-
47
-
48
-
49
-
50
-
51
-
52
-
53
-
54
-
55
-
56
-
57
-
58
-
59
-
60
-
61
-
62
-
63
-
64
-
65
-
66
-
67
-
68
-
69
-
70
-
71
-
72
-
73
-
74
-
75
-
76
-
77
-
78
-
79
-
80
-
81
-
82
-
83
-
84
-
85
-
86
-
87
-
88
-
89
-
90
-
91
-
92
-
93
-
94
-
95
-
96
-
97
-
98
-
99
-
100
-
101
-
102
-
103
-
104
-
105
-
106
-
107
-
108
-
109
-
110
-
111
-
112
-
113
-
114
-
115
-
116
-
117
-
118
-
119
-
120
-
121
-
122
-
123
-
124
-
125
-
 126
126 -
 127
127 -
 128
128 -
 129
129 -
 130
130 -
 131
131 -
 132
132 -
 133
133 -
 134
134 -
 135
135 -
 136
136 -
 137
137 -
 138
138 -
 139
139 -
 140
140 -
 141
141 -
 142
142 -
 143
143 -
 144
144 -
 145
145 -
 146
146 -
147
-
148
-
149
-
150
-
151
-
152
-
153
-
154
-
155
-
156
-
157
-
158
-
159
-
160
-
161
-
162
-
163
-
164
-
165
-
166
-
167
-
168
-
169
-
170
-
171
-
172
-
173
-
174
-
175
-
176
-
177
-
178
-
179
-
180
-
181
-
182
-
183
-
184
-
185
-
186
-
187
-
188
-
189
-
190
 |
 |

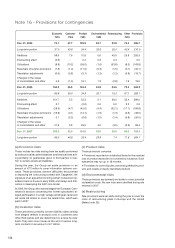
(a) Economic risks
These include tax risks arising from tax audits performed
by various local tax administrations and financial risks aris-
ing primarily on guarantees given to third parties in rela-
tion to certain assets and liabilities.
During the year, the Group set aside provisions in an
amount of 72 million to cover information systems con-
tracts. These provisions concern difficulties encountered
in deploying the outsourcing contract with Capgemini, the
signature of an agreement to bring certain outsourced op-
erations back in house in early 2008, and delays and diffi-
culties in developing the SAP core model.
In 2006, the Group also acknowledged the European Com-
mission’s decision concerning two former subsidiaries’ al-
leged participation in a high voltage switchgear cartel and
set aside 8 million to cover the related fine, which was
paid in 2007.
(b) Customer risks
These provisions primarily concern liability claims arising
from alleged defects in products sold to customers and
other third parties and are determined on a case-by-case
basis. They also cover losses at the end of various long-
term contracts in an amount of 7 million.
(c) Product risks
These provisions comprise:
Provisions recorded on a statistical basis for the residual
cost of product warranties not covered by insurance. Such
warranties may run up to 18 months,
Provisions to cover disputes concerning defective prod-
ucts and recalls of clearly identified products.
(d) Environmental risks
These provisions are primarily set aside to cover potential
reclamation costs. No new risks were identified during site
reviews in 2007.
(e) Restructuring
New provisions were set aside during the year to cover the
costs of restructuring plans in Europe and the United
States (note 25).
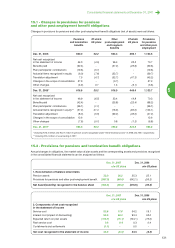
Note 16 - Provisions for contingencies
Economic Customer Product Environmental Restructuring Other Provisions
risks risks risks risks risks
Dec. 31, 2005 75.1 67.7 139.9 39.7 93.8 70.5 486.7
Long-term portion 37.0 43.6 34.4 32.6 20.0 42.4 210.0
Additions 99.5 7.6 70.9 5.6 49.9 25.8 259.3
Discounting effect (0.3) - 0.2 0.3 0.3 - 0.5
Utilizations (9.9) (10.2) (59.0) (1.6) (53.8) (9.3) (143.8)
Reversals of surplus provisions (7.5) (1.0) (17.6) (0.3) (1.6) (4.7) (32.7)
Translation adjustments (0.5) (5.8) (5.1) (1.2) (1.2) (5.9) (19.7)
Changes in the scope
of consolidation and other 4.5 (1.5) 16.1 1.3 (2.8) 1.9 19.5
Dec. 31, 2006 160.9 56.8 145.4 43.8 84.6 78.3 569.8
Long-term portion 83.8 50.0 34.9 32.1 15.2 67.1 283.1
Additions 151.7 5.5 52.3 2.1 39.0 35.4 286.0
Discounting effect 0.1 - (0.0) 0.0 0.2 0.3 0.6
Utilizations (28.5) (4.7) (42.0) (4.4) (62.1) (17.1) (158.8)
Reversals of surplus provisions (16.9) (0.1) (14.1) (1.5) (1.3) (2.6) (36.5)
Translation adjustments 0.1 (5.3) (6.6) (1.0) (1.4) (5.8) (20.0)
Changes in the scope
of consolidation and other 41.5 0.8 29.5 4.0 (3.5) (3.9) 68.4
Dec. 31, 2007 308.9 53.0 164.5 43.0 55.5 84.6 709.6
Long-term portion 85.0 44.8 25.4 29.9 7.4 71.6 264.1
134