APC 2007 Annual Report Download - page 141
Download and view the complete annual report
Please find page 141 of the 2007 APC annual report below. You can navigate through the pages in the report by either clicking on the pages listed below, or by using the keyword search tool below to find specific information within the annual report.-
 1
1 -
2
-
3
-
4
-
5
-
6
-
7
-
8
-
9
-
10
-
11
-
12
-
13
-
14
-
15
-
16
-
17
-
18
-
19
-
20
-
21
-
22
-
23
-
24
-
25
-
26
-
27
-
28
-
29
-
30
-
31
-
32
-
33
-
34
-
35
-
36
-
37
-
38
-
39
-
40
-
41
-
42
-
43
-
44
-
45
-
46
-
47
-
48
-
49
-
50
-
51
-
52
-
53
-
54
-
55
-
56
-
57
-
58
-
59
-
60
-
61
-
62
-
63
-
64
-
65
-
66
-
67
-
68
-
69
-
70
-
71
-
72
-
73
-
74
-
75
-
76
-
77
-
78
-
79
-
80
-
81
-
82
-
83
-
84
-
85
-
86
-
87
-
88
-
89
-
90
-
91
-
92
-
93
-
94
-
95
-
96
-
97
-
98
-
99
-
100
-
101
-
102
-
103
-
104
-
105
-
106
-
107
-
108
-
109
-
110
-
111
-
112
-
113
-
114
-
115
-
116
-
117
-
118
-
119
-
120
-
121
-
122
-
123
-
124
-
125
-
126
-
127
-
128
-
129
-
130
-
 131
131 -
 132
132 -
 133
133 -
 134
134 -
 135
135 -
 136
136 -
 137
137 -
 138
138 -
 139
139 -
 140
140 -
 141
141 -
 142
142 -
 143
143 -
 144
144 -
 145
145 -
 146
146 -
 147
147 -
 148
148 -
 149
149 -
 150
150 -
 151
151 -
152
-
153
-
154
-
155
-
156
-
157
-
158
-
159
-
160
-
161
-
162
-
163
-
164
-
165
-
166
-
167
-
168
-
169
-
170
-
171
-
172
-
173
-
174
-
175
-
176
-
177
-
178
-
179
-
180
-
181
-
182
-
183
-
184
-
185
-
186
-
187
-
188
-
189
-
190
 |
 |

5
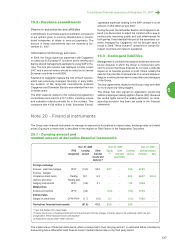
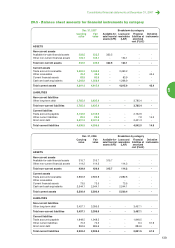
Consolidated financial statements at December 31, 2007
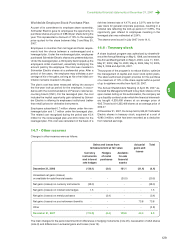
20.5 - Balance sheet amounts for financial instruments by category
Dec. 31, 2007 Breakdown by category
Carrying Fair
Available-for- Loans and Financial Derivative
value value
sale financial receivables liabilities at instruments
assets (AFS) (LAR) amortized
cost (FLAC)
ASSETS
Non-current assets
Available-for-sale financial assets 322.5 322.5 322.5 - - -
Other non-current financial assets 124.1 124.1 - 124.1 - -
Total non-current assets 446.6 446.6 322.5 124.1 - -
Current assets
Trade accounts receivable 3,463.2 3,463.2 - 3,463.2 - -
Other receivables 45.4 45.4 - - - 45.4
Current financial assets 83.9 83.9 - 83.9 - -
Cash and cash equivalents 1,268.9 1,268.9 - 1,268.9 - -
Total current assets 4,861.4 4,815.9 - 4,815.9 - 45.4
LIABILITIES
Non-current liabilities
Other long-term debt 3,785.4 3,635.4 - - 3,785.4 -
Total non-current liabilities 3,785.4 3,635.4 - - 3,785.4 -
Current liabilites
Trade accounts payable 2,132.9 2,132.9 - - 2,132.9 -
Other current liabilities 22.3 22.3 - - 7.8 14.5
Short-term debt 2,401.3 2,401.3 - - 2,401.3 -
Total current liabilities 4,556.5 4,556.5 - - 4,542.0 14.5
Dec. 31, 2006 Breakdown by category
Carrying Fair
Available-for- Loans and Financial Derivative
value value
sale financial receivables liabilities at instruments
assets (AFS) (LAR) amortized
cost (FLAC)
ASSETS
Non-current assets
Available-for-sale financial assets 315.7 315.7 315.7 - - -
Other non-current financial assets 114.2 114.2 - 114.2 - -
Total non-current assets 429.9 429.9 315.7 114.2 - -
Current assets
Trade accounts receivable 2,882.8 2,882.8 - 2,882.8 - -
Other receivables - - - - - -
Current financial assets 73.5 73.5 - 73.5 - -
Cash and cash equivalents 2,544.1 2,544.1 - 2,544.1 - -
Total current assets 5,500.4 5,500.4 - 5,500.4 - -
LIABILITIES
Non-current liabilities
Other long-term debt 3,457.1 3,395.6 - - 3,457.1 -
Total non-current liabilities 3,457.1 3,395.6 - - 3,457.1 -
Current liabilites
Trade accounts payable 1,948.5 1,948.5 - - 1,948.5 -
Other current liabilities 70.3 70.3 - - 8.4 61.9
Short-term debt 884.6 884.6 - - 884.6 -
Total current liabilities 2,903.4 2,903.4 - - 2,841.5 61.9
139