APC 2007 Annual Report Download - page 118
Download and view the complete annual report
Please find page 118 of the 2007 APC annual report below. You can navigate through the pages in the report by either clicking on the pages listed below, or by using the keyword search tool below to find specific information within the annual report.-
 1
1 -
2
-
3
-
4
-
5
-
6
-
7
-
8
-
9
-
10
-
11
-
12
-
13
-
14
-
15
-
16
-
17
-
18
-
19
-
20
-
21
-
22
-
23
-
24
-
25
-
26
-
27
-
28
-
29
-
30
-
31
-
32
-
33
-
34
-
35
-
36
-
37
-
38
-
39
-
40
-
41
-
42
-
43
-
44
-
45
-
46
-
47
-
48
-
49
-
50
-
51
-
52
-
53
-
54
-
55
-
56
-
57
-
58
-
59
-
60
-
61
-
62
-
63
-
64
-
65
-
66
-
67
-
68
-
69
-
70
-
71
-
72
-
73
-
74
-
75
-
76
-
77
-
78
-
79
-
80
-
81
-
82
-
83
-
84
-
85
-
86
-
87
-
88
-
89
-
90
-
91
-
92
-
93
-
94
-
95
-
96
-
97
-
98
-
99
-
100
-
101
-
102
-
103
-
104
-
105
-
106
-
107
-
 108
108 -
 109
109 -
 110
110 -
 111
111 -
 112
112 -
 113
113 -
 114
114 -
 115
115 -
 116
116 -
 117
117 -
 118
118 -
 119
119 -
 120
120 -
 121
121 -
 122
122 -
 123
123 -
 124
124 -
 125
125 -
 126
126 -
 127
127 -
 128
128 -
129
-
130
-
131
-
132
-
133
-
134
-
135
-
136
-
137
-
138
-
139
-
140
-
141
-
142
-
143
-
144
-
145
-
146
-
147
-
148
-
149
-
150
-
151
-
152
-
153
-
154
-
155
-
156
-
157
-
158
-
159
-
160
-
161
-
162
-
163
-
164
-
165
-
166
-
167
-
168
-
169
-
170
-
171
-
172
-
173
-
174
-
175
-
176
-
177
-
178
-
179
-
180
-
181
-
182
-
183
-
184
-
185
-
186
-
187
-
188
-
189
-
190
 |
 |

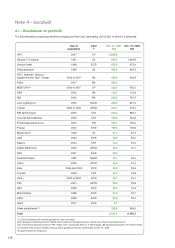
Note 4 - Goodwill
4.1 - Breakdown of goodwill
The following table presents goodwill by company and the Cash Generating Unit (CGU) to which it is allocated:
Year of CGU Dec. 31, 2007 Dec. 31, 2006
acquisition (1) Net Net
APC 2007 CP 2,064.6 -
Square D Company 1991 (A) 934.0 1,044.8
Groupe Lexel 1999 EOD 875.4 873.4
Telemecanique 1988 (A) 462.6 462.6
TAC / Andover / Abacus /
Applied Control Tech. / Yamas 2003 to 2007 BA 425.8 605.8
Pelco 2007 BA 352.0 -
MGE UPS (2) 2000 to 2007 CP 333.4 545.5
ABS 2005 BA 112.7 113.9
IBS 2006 BA 292.6 197.2
Juno Lighting Inc. 2005 NAOD 269.3 301.0
Clipsal 2004 to 2006 APOD 263.7 278.0
BEI Technologies 2005 CST 264.3 283.1
Crouzet Automatismes 2000 CST 155.8 161.8
Power Measurement Inc. 2005 PW 129.7 145.0
Positec 2000 EOD 105.9 105.9
Merlin Gerin 1992 (A) 87.2 87.2
OVA 2006 EOD 79.5 80.0
Kavlico 2004 CST 74.3 81.6
Digital Electronics 2002 APOD 68.4 76.1
Ritto 2007 EOD 59.4 -
Federal Pioneer 1990 NAOD 57.1 54.0
Citect 2006 APOD 56.2 67.2
Elau 2004 and 2005 EOD 55.6 55.6
Crydom 2006 CST 46.7 43.9
Infra + 2000 to 2004 EOD 43.1 43.1
PDL 2001 APOD 32.4 32.8
GET 2006 EOD 32.3 31.6
Mita Holding 1999 EOD 31.8 34.7
AEM 2006 EOD 30.4 30.4
Grant 2007 EOD 2.1 -
Other subsidiaries (3) 342.8 349.5
Total 8,141.2 6,185.7
(1) Cash Generating Unit to which goodwill has been allocated.
EOD: European Operating Division, NAOD: North American Operating Division, APOD: Asia-Pacific Operating Division,
IOD: International Operating Division, PW : Power, CST: Customized Sensors & Technologies, BA: Building Automation, CP: Critical Power.
(2) Of which
32.0 million related to the put option granted to minority shareholders at Dec. 31, 2006.
(3) Approximately 50 companies.
116