APC 2007 Annual Report Download - page 85
Download and view the complete annual report
Please find page 85 of the 2007 APC annual report below. You can navigate through the pages in the report by either clicking on the pages listed below, or by using the keyword search tool below to find specific information within the annual report.-
 1
1 -
2
-
3
-
4
-
5
-
6
-
7
-
8
-
9
-
10
-
11
-
12
-
13
-
14
-
15
-
16
-
17
-
18
-
19
-
20
-
21
-
22
-
23
-
24
-
25
-
26
-
27
-
28
-
29
-
30
-
31
-
32
-
33
-
34
-
35
-
36
-
37
-
38
-
39
-
40
-
41
-
42
-
43
-
44
-
45
-
46
-
47
-
48
-
49
-
50
-
51
-
52
-
53
-
54
-
55
-
56
-
57
-
58
-
59
-
60
-
61
-
62
-
63
-
64
-
65
-
66
-
67
-
68
-
69
-
70
-
71
-
72
-
73
-
74
-
 75
75 -
 76
76 -
 77
77 -
 78
78 -
 79
79 -
 80
80 -
 81
81 -
 82
82 -
 83
83 -
 84
84 -
 85
85 -
 86
86 -
 87
87 -
 88
88 -
 89
89 -
 90
90 -
 91
91 -
 92
92 -
 93
93 -
 94
94 -
 95
95 -
96
-
97
-
98
-
99
-
100
-
101
-
102
-
103
-
104
-
105
-
106
-
107
-
108
-
109
-
110
-
111
-
112
-
113
-
114
-
115
-
116
-
117
-
118
-
119
-
120
-
121
-
122
-
123
-
124
-
125
-
126
-
127
-
128
-
129
-
130
-
131
-
132
-
133
-
134
-
135
-
136
-
137
-
138
-
139
-
140
-
141
-
142
-
143
-
144
-
145
-
146
-
147
-
148
-
149
-
150
-
151
-
152
-
153
-
154
-
155
-
156
-
157
-
158
-
159
-
160
-
161
-
162
-
163
-
164
-
165
-
166
-
167
-
168
-
169
-
170
-
171
-
172
-
173
-
174
-
175
-
176
-
177
-
178
-
179
-
180
-
181
-
182
-
183
-
184
-
185
-
186
-
187
-
188
-
189
-
190
 |
 |

83
4
Business review
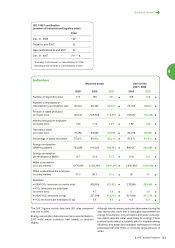
2007 audited indicators
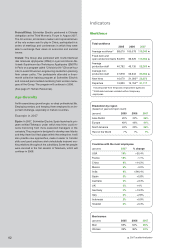
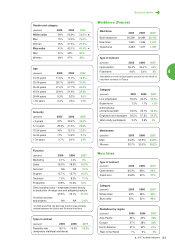
Workforce (France)
Workforce 2005 2006 2007
Spot headcount 20,538 20,364 20,150
New hires 1,645 1,624 1,811
Departures 2,283 1,611 1,787
Type of contract
(percent)
2005 2006 2007
Open-ended 95.4% 94.4% 95%
Fixed-term 4.6% 5.6% 5%
Individuals on work-study programs account for two-thirds of
fixed-term contracts in France.
Category
(percent)
2005 2006 2007
Line employees 35.6% 34.4% 32.6%
Supervisors 1.2% 1.1% 1.2%
Administrative
and technical staff
33.5% 33.1% 32.5%
Engineers and managers 26.5% 27.5% 29.7%
Work-study participants 3.2% 3.9% 4%
Men/women
(percent)
2005 2006 2007
Men 64.3% 64.8% 64.8%
Women 35.7% 35.2% 35.2%
Type of contract
(percent)
2005 2006 2007
Open-ended 65.2% 68% 63%
Fixed-term 34.8% 32% 37%
Category
(percent)
2005 2006 2007
White collar 45% 48% 52%
Blue collar 55% 52% 48%
Breakdown by region
(percent)
2005 2006 2007
Asia-Pacific 25% 29% 36%
Europe 27% 28% 28%
North America 41% 34% 27%
Rest of the World 7% 9% 9%
New hires
Gender and category
(percent)
2005 2006 2007
White collar 59% 56.9% 58.6%
Men 75% 72.5% 72.6%
Women 25% 27.5% 27.4%
Blue collar 41% 43.1% 41.4%
Men 51% 53% 57%
Women 49% 47% 43%
Age
(percent)
2005 2006 2007
14-24 years 11.9% 11.2% 12.3%
25-34 years 28.1% 29.6% 31.3%
35-44 years 27.4% 27.7% 26.5%
45-54 years 22.9% 21.8% 20.8%
55-64 years 9.3% 9.2% 8.6%
> 64 years 0.4% 0.5% 0.5%
Seniority
(percent)
2005 2006 2007
< 5 years 42% 43.4% 49.5%
5-14 years 28.3% 27.5% 26.6%
15-24 years 16% 15.1% 12.8%
25-34 years 11% 10.6% 8.7%
> 34 years 2.7% 3.4% 2.4%
Function
(percent)
2005 2006 2007
Marketing 4.1% 4.4% 4%
Sales 18.3% 18.3% 16.9%
Services* NA NA 2.2%
Support 15.7% 15.7% 16.3%
Technical 7.5% 8.3% 7.1%
Production 10.8% 10.2% 12%
Direct variable costs – employees linked directly
to production of range core and adapted products
43.6% 43.1% 41.5%
Of which services
and projects NA NA 2.6%
*In 2005 and 2006, the Services function was primarily
divided between the Sales and Technical functions.
Type of contract
(percent)
2005 2006 2007
Flexibility rate 18.1% 19.5% 22.5%
(temporary staff/total workforce)