APC 2010 Annual Report Download - page 100
Download and view the complete annual report
Please find page 100 of the 2010 APC annual report below. You can navigate through the pages in the report by either clicking on the pages listed below, or by using the keyword search tool below to find specific information within the annual report.-
 1
1 -
2
-
3
-
4
-
5
-
6
-
7
-
8
-
9
-
10
-
11
-
12
-
13
-
14
-
15
-
16
-
17
-
18
-
19
-
20
-
21
-
22
-
23
-
24
-
25
-
26
-
27
-
28
-
29
-
30
-
31
-
32
-
33
-
34
-
35
-
36
-
37
-
38
-
39
-
40
-
41
-
42
-
43
-
44
-
45
-
46
-
47
-
48
-
49
-
50
-
51
-
52
-
53
-
54
-
55
-
56
-
57
-
58
-
59
-
60
-
61
-
62
-
63
-
64
-
65
-
66
-
67
-
68
-
69
-
70
-
71
-
72
-
73
-
74
-
75
-
76
-
77
-
78
-
79
-
80
-
81
-
82
-
83
-
84
-
85
-
86
-
87
-
88
-
89
-
 90
90 -
 91
91 -
 92
92 -
 93
93 -
 94
94 -
 95
95 -
 96
96 -
 97
97 -
 98
98 -
 99
99 -
 100
100 -
 101
101 -
 102
102 -
 103
103 -
 104
104 -
 105
105 -
 106
106 -
 107
107 -
 108
108 -
 109
109 -
 110
110 -
111
-
112
-
113
-
114
-
115
-
116
-
117
-
118
-
119
-
120
-
121
-
122
-
123
-
124
-
125
-
126
-
127
-
128
-
129
-
130
-
131
-
132
-
133
-
134
-
135
-
136
-
137
-
138
-
139
-
140
-
141
-
142
-
143
-
144
-
145
-
146
-
147
-
148
-
149
-
150
-
151
-
152
-
153
-
154
-
155
-
156
-
157
-
158
-
159
-
160
-
161
-
162
-
163
-
164
-
165
-
166
-
167
-
168
-
169
-
170
-
171
-
172
-
173
-
174
-
175
-
176
-
177
-
178
-
179
-
180
-
181
-
182
-
183
-
184
-
185
-
186
-
187
-
188
-
189
-
190
-
191
-
192
-
193
-
194
-
195
-
196
-
197
-
198
-
199
-
200
-
201
-
202
-
203
-
204
-
205
-
206
-
207
-
208
-
209
-
210
-
211
-
212
-
213
-
214
-
215
-
216
-
217
-
218
-
219
-
220
-
221
-
222
-
223
-
224
-
225
-
226
-
227
-
228
-
229
-
230
-
231
-
232
-
233
-
234
-
235
-
236
-
237
-
238
-
239
-
240
-
241
-
242
-
243
-
244
-
245
-
246
-
247
-
248
-
249
-
250
-
251
-
252
-
253
-
254
-
255
-
256
-
257
-
258
-
259
-
260
-
261
-
262
-
263
-
264
-
265
-
266
-
267
-
268
-
269
-
270
-
271
-
272
-
273
-
274
-
275
-
276
-
277
-
278
-
279
-
280
-
281
-
282
-
283
-
284
-
285
-
286
-
287
-
288
-
289
-
290
-
291
-
292
 |
 |

SUSTAINABLE DEVELOPMENT
2INDICATORS
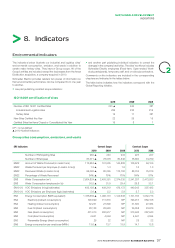
GRI indicators Current Scope Constant Scope
2010 2009 2008 2010 2009
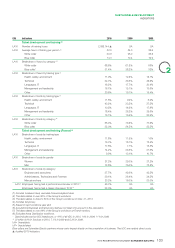
EN16 CO2 emissions linked to energy consumption
(in metric tons) (estimates)
411,177 357,513 388,125 370,882 341,991
EN17 Electricity (indirect emission) 323,429 278,809 NP 287,818 266,042
EN17 Heating (indirect emission) 10,995 9,570 NP 10,530 9,121
EN16 Fuel Oil (direct emission) 7,313 7,520 NP 6,593 6,234
EN16 Gas (direct emission) 67,857 60,048 NP 64,358 59,028
EN16 Coal (direct emission) 1,583 1,566 NP 1,583 1,566
EN16 Renewable Energy 0 0 NP 0 0
EN16 CO2/Employee (in metric tons/person) 4.7 4.6 4.8 4.7 4.6
EN16 SF6 Emissions (in CO2 equivalent metric tons)* 60,491 135,895 178,700 60,491 135,895
EN16 Direct and Indirect CO2 Emissions (SF6 energy
consumption and emissions in metric tons)
471,668 493,408 566,825 431,373 477,886
▲ 2010 Audited Indicators
NP = Not Published
* The CO2 emissions linked to energy consumption are considered estimates, because the indirect emissions are calculated on the
conversion factors per country.
** 9 sites used SF6 in 2009 and 2010.
2010 REGISTRATION DOCUMENT SCHNEIDER ELECTRIC98