APC 2010 Annual Report Download - page 90
Download and view the complete annual report
Please find page 90 of the 2010 APC annual report below. You can navigate through the pages in the report by either clicking on the pages listed below, or by using the keyword search tool below to find specific information within the annual report.-
 1
1 -
2
-
3
-
4
-
5
-
6
-
7
-
8
-
9
-
10
-
11
-
12
-
13
-
14
-
15
-
16
-
17
-
18
-
19
-
20
-
21
-
22
-
23
-
24
-
25
-
26
-
27
-
28
-
29
-
30
-
31
-
32
-
33
-
34
-
35
-
36
-
37
-
38
-
39
-
40
-
41
-
42
-
43
-
44
-
45
-
46
-
47
-
48
-
49
-
50
-
51
-
52
-
53
-
54
-
55
-
56
-
57
-
58
-
59
-
60
-
61
-
62
-
63
-
64
-
65
-
66
-
67
-
68
-
69
-
70
-
71
-
72
-
73
-
74
-
75
-
76
-
77
-
78
-
79
-
 80
80 -
 81
81 -
 82
82 -
 83
83 -
 84
84 -
 85
85 -
 86
86 -
 87
87 -
 88
88 -
 89
89 -
 90
90 -
 91
91 -
 92
92 -
 93
93 -
 94
94 -
 95
95 -
 96
96 -
 97
97 -
 98
98 -
 99
99 -
 100
100 -
101
-
102
-
103
-
104
-
105
-
106
-
107
-
108
-
109
-
110
-
111
-
112
-
113
-
114
-
115
-
116
-
117
-
118
-
119
-
120
-
121
-
122
-
123
-
124
-
125
-
126
-
127
-
128
-
129
-
130
-
131
-
132
-
133
-
134
-
135
-
136
-
137
-
138
-
139
-
140
-
141
-
142
-
143
-
144
-
145
-
146
-
147
-
148
-
149
-
150
-
151
-
152
-
153
-
154
-
155
-
156
-
157
-
158
-
159
-
160
-
161
-
162
-
163
-
164
-
165
-
166
-
167
-
168
-
169
-
170
-
171
-
172
-
173
-
174
-
175
-
176
-
177
-
178
-
179
-
180
-
181
-
182
-
183
-
184
-
185
-
186
-
187
-
188
-
189
-
190
-
191
-
192
-
193
-
194
-
195
-
196
-
197
-
198
-
199
-
200
-
201
-
202
-
203
-
204
-
205
-
206
-
207
-
208
-
209
-
210
-
211
-
212
-
213
-
214
-
215
-
216
-
217
-
218
-
219
-
220
-
221
-
222
-
223
-
224
-
225
-
226
-
227
-
228
-
229
-
230
-
231
-
232
-
233
-
234
-
235
-
236
-
237
-
238
-
239
-
240
-
241
-
242
-
243
-
244
-
245
-
246
-
247
-
248
-
249
-
250
-
251
-
252
-
253
-
254
-
255
-
256
-
257
-
258
-
259
-
260
-
261
-
262
-
263
-
264
-
265
-
266
-
267
-
268
-
269
-
270
-
271
-
272
-
273
-
274
-
275
-
276
-
277
-
278
-
279
-
280
-
281
-
282
-
283
-
284
-
285
-
286
-
287
-
288
-
289
-
290
-
291
-
292
 |
 |

SUSTAINABLE DEVELOPMENT
2METHODOLOGY ANDAUDIT OFINDICATORS
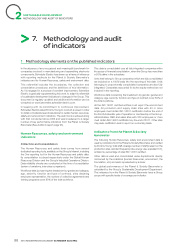
In the absence of any recognised and meaningful benchmark for
companies involved in manufacturing and assembling electronic
components, Schneider Electric has drawn up a frame of reference
with reporting methods for the Planet & Society Barometer’s
indicators and for Human Resources, safety and environment data.
This referential includes the boundaries, the collection and
consolidation procedures and the defi nitions of this information.
As it is engaged in a process of constant improvement, Schneider
Electric is gradually supplementing this work to adapt its referential
of sustainable development indicators to changes in the Group. This
document is regularly updated and additional information can be
consulted on www.barometer.schneider-electric.com.
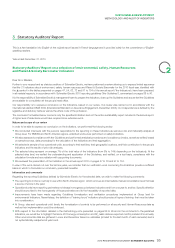
In keeping with its commitment to continuous improvement,
Schneider Electric asked Ernst & Young to conduct a review in order
to obtain a moderate level of assurance for certain human resources,
safety and environment indicators. The audit work is entered along
with that conducted since 2006 and was broadened to a larger
number of key performance indicators from the Planet & Society
Barometer (See Auditor’s report page95).
Human Resources, safety and environment
indicators
Collection and consolidation
The Human Resources and safety data comes from several
dedicated reporting tools, available on the Group’s Intranet, including
the One reporting tool for the Human Resources and safety data.
Its consolidation is placed respectively under the Global Human
Resources Division and the Group’s Industrial Operations Division.
Data reliability checks are conducted at the time of consolidation
(review of variations, inter-sites comparison).
Workforce data (concerning the breakdown by gender and category,
age, seniority, function and type of contract), sites declaring
employee representation, the number of collective agreements and
training programs cover 80% of the total workforce.
This data is consolidated over all fully integrated companies within
the scope of fi nancial consolidation, when the Group has more than
a 50% stake in the subsidiary.
Units that belong to Group companies which are fully consolidated
are included on a 100% basis into the reporting of this data. Units
belonging to proportionally consolidated companies are also fully
integrated. Companies accounted for by the equity method are not
included in the reporting.
Workforce data concerning the breakdown by gender, gender and
category, age, seniority, function and type of contract cover 80% of
the total workforce.
All the ISO14001 certifi ed entities must report the environment
data. All production and supply chain sites with 50 or more
employees must obtain ISO14001 certifi cation before the end of
the third full calendar year of operation or membership in the Group.
Administrative, R&D and sales sites with 300employees or more
must obtain ISO14001 certifi cation by the end of 2011. Other sites
may seek certifi cation and/or report on a voluntary basis.
Indicators from the Planet & Society
barometer
The following Human Resources, safety and environment data is
used by indicators from the Planet & Society Barometer and verifi ed
by Ernst & Young: total staff, average number of staff present on the
production sites, accident frequency rate, energy use, equivalent CO2
emissions, percentage of sites ISO14001 certifi ed.
Other data is used and consolidated under departments directly
concerned by the indicators (Human Resources, environment, the
Foundation, etc) and each represented by a driver.
The global performance of the Planet & Society Barometer is
calculated by the Group’s Sustainable Development Department.
The indicators from the Planet & Society Barometer have a Group
scope with specifi c levels of coverage per indicator.
>
7. Methodology andaudit
ofindicators
1 Methodology elements on the published indicators
2010 REGISTRATION DOCUMENT SCHNEIDER ELECTRIC88