APC 2010 Annual Report Download - page 146
Download and view the complete annual report
Please find page 146 of the 2010 APC annual report below. You can navigate through the pages in the report by either clicking on the pages listed below, or by using the keyword search tool below to find specific information within the annual report.-
 1
1 -
2
-
3
-
4
-
5
-
6
-
7
-
8
-
9
-
10
-
11
-
12
-
13
-
14
-
15
-
16
-
17
-
18
-
19
-
20
-
21
-
22
-
23
-
24
-
25
-
26
-
27
-
28
-
29
-
30
-
31
-
32
-
33
-
34
-
35
-
36
-
37
-
38
-
39
-
40
-
41
-
42
-
43
-
44
-
45
-
46
-
47
-
48
-
49
-
50
-
51
-
52
-
53
-
54
-
55
-
56
-
57
-
58
-
59
-
60
-
61
-
62
-
63
-
64
-
65
-
66
-
67
-
68
-
69
-
70
-
71
-
72
-
73
-
74
-
75
-
76
-
77
-
78
-
79
-
80
-
81
-
82
-
83
-
84
-
85
-
86
-
87
-
88
-
89
-
90
-
91
-
92
-
93
-
94
-
95
-
96
-
97
-
98
-
99
-
100
-
101
-
102
-
103
-
104
-
105
-
106
-
107
-
108
-
109
-
110
-
111
-
112
-
113
-
114
-
115
-
116
-
117
-
118
-
119
-
120
-
121
-
122
-
123
-
124
-
125
-
126
-
127
-
128
-
129
-
130
-
131
-
132
-
133
-
134
-
135
-
 136
136 -
 137
137 -
 138
138 -
 139
139 -
 140
140 -
 141
141 -
 142
142 -
 143
143 -
 144
144 -
 145
145 -
 146
146 -
 147
147 -
 148
148 -
 149
149 -
 150
150 -
 151
151 -
 152
152 -
 153
153 -
 154
154 -
 155
155 -
 156
156 -
157
-
158
-
159
-
160
-
161
-
162
-
163
-
164
-
165
-
166
-
167
-
168
-
169
-
170
-
171
-
172
-
173
-
174
-
175
-
176
-
177
-
178
-
179
-
180
-
181
-
182
-
183
-
184
-
185
-
186
-
187
-
188
-
189
-
190
-
191
-
192
-
193
-
194
-
195
-
196
-
197
-
198
-
199
-
200
-
201
-
202
-
203
-
204
-
205
-
206
-
207
-
208
-
209
-
210
-
211
-
212
-
213
-
214
-
215
-
216
-
217
-
218
-
219
-
220
-
221
-
222
-
223
-
224
-
225
-
226
-
227
-
228
-
229
-
230
-
231
-
232
-
233
-
234
-
235
-
236
-
237
-
238
-
239
-
240
-
241
-
242
-
243
-
244
-
245
-
246
-
247
-
248
-
249
-
250
-
251
-
252
-
253
-
254
-
255
-
256
-
257
-
258
-
259
-
260
-
261
-
262
-
263
-
264
-
265
-
266
-
267
-
268
-
269
-
270
-
271
-
272
-
273
-
274
-
275
-
276
-
277
-
278
-
279
-
280
-
281
-
282
-
283
-
284
-
285
-
286
-
287
-
288
-
289
-
290
-
291
-
292
 |
 |

BUSINESS REVIEW
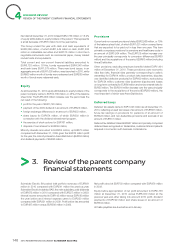
4REVIEW OF THE CONSOLIDATED FINANCIAL STATEMENTS
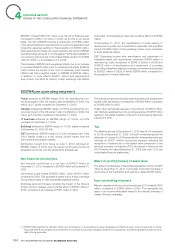
EBITAR(1) totaled EUR3,027 million over the 2010 fi nancial year,
compared to EUR2,110 million in 2009, up 43.5% on an actual
basis. The 2010 EBITAR includes a contribution of EUR85 million
in the Areva Distribution business and non-recurring separation and
integration expenses relating to this acquisition for EUR25 million.
After adjustment for these non-recurring items, the Group’s EBITAR
operating margin amounts to 16.2% against 12.8% (also restated for
non-recurring items bound to the United States pension for EUR92
million) in 2009, i.e. an increase of 3.4 points.
The increase in EBITAR can be explained mainly due to an increase
in volumes (EUR630 million) and to industrial productivity (EUR505
million before the impact of the cost of materials). Raw material
infl ation has had a negative impact on EBITAR of EUR184 million,
in addition to price effects (EUR41 million) and geographical
and product mix (EUR 34 million). Finally, exchange rate effects
(conversion and transaction) have had a positive effect of EUR192
million.
At December31, 2010, the capitalisation of costs relating to
development projects net of amortisation expenses had a positive
impact of EUR90 million on the operating income, down compared
to 2009 (EUR126 million).
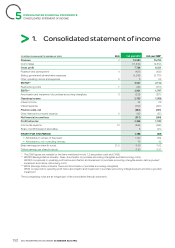
EBIT (Operating income after amortisation and impairment of
intangible assets and acquisitions) comprises EUR96 million of
restructuring costs (compared to EUR313 million in 2009) and
EUR228 million of amortisation and impairment of purchase
accounting intangibles relating to business combinations (compared
to EUR231 million in 2009), of which EUR43 million correspond to
the acquisition of Areva Distribution.
(1) EBITAR (Earnings Before Interests, Taxes and Amortisation of purchase accounting intangibles and Restructuring costs) corresponds to opera-
ting profi t before amortisation and impairment of purchase accounting intangible assets from acquisitions, and before goodwill impairment and
restructuring expenses.
EBITAR per operating segment
Power achieved an EBITAR margin of 20.1%; excluding the non-
recurring impact of the US pension plan modifi cation in 2009, this
rate is up 2.7 points compared to December31, 2009.
Industry achieved an EBITAR margin of 18.8%; excluding the non-
recurring impact of the US pension plan modifi cation in 2009, this
rate is up 8.9 points compared to December31, 2009.
IT business achieved an EBITAR margin of 16.9%, up 0.9%
compared to December31, 2009.
Buildings achieved an EBITAR margin of 10.3%, stable compared
to December31, 2009 (10.4%).
CST achieved an EBITAR margin of 16.4%, compared with 5.6%
2009, thanks notably to a very strong volume impact from the
automotive and industrial markets.
Distribution, bought from Areva on June 7, 2010, achieved an
EBITAR margin of 6.9% over the seven-month period since its
acquisition and 5.3% over the whole 2010 fi nancial year.
Net financial income/loss
Net financial income/loss is a net loss of EUR347million at
December31, 2010, compared to EUR384 million at December31,
2009.
Net fi nance costs totaled EUR282million, down EUR15million
compared to 2009. This decrease is mainly due to a drop in average
Group interest rates on debt (especially regarding bonds).
Exchange gains and losses, including the impact of the Group’s
foreign currency hedges, was a positive effect of EUR25 million in
2010, compared to an expense of EUR1million in 2009.
The fi nancial component of pension plan and other post-employment
benefi t costs represents a net expense of EUR49 million compared
to EUR56million in 2009.
Finally, other net fi nancial expense, in the amount of EUR53 million,
can mainly be explained by a non-recurring expense of EUR36 million
relating to the partial buyback of the 2013 bond bearing fi xed-rate
interest of 6.75%.
Tax
The effective tax rate at December31, 2010 was 24.0% compared
to 25.0% at December31, 2009. It is worth remembering that the
statement of income for 2009 presented for comparative purposes
includes an EUR11 million income tax expense reflecting the
recognition of deferred tax on the added value component of the
territorial economic contribution (TEC) introduced in France by the
2010 Finance Act dated December31, 2009 (see note 1.2 to the
consolidated fi nancial statements).
Share of profit/(losses) of associates
The share of profi t/losses of associates represents income of EUR6
million at December31, 2010. It principally comprises the share in
net income of the Fuji Electric joint venture in Japan (EUR5 million).
Non-controlling interests
Minority interests in net income for fi nancial year 2010 totaled EUR76
million, compared to EUR42 million in 2009. This represents the
share in net income attributable mainly to the minority interests of
certain Chinese companies.
2010 REGISTRATION DOCUMENT SCHNEIDER ELECTRIC144