APC 2010 Annual Report Download - page 230
Download and view the complete annual report
Please find page 230 of the 2010 APC annual report below. You can navigate through the pages in the report by either clicking on the pages listed below, or by using the keyword search tool below to find specific information within the annual report.-
 1
1 -
2
-
3
-
4
-
5
-
6
-
7
-
8
-
9
-
10
-
11
-
12
-
13
-
14
-
15
-
16
-
17
-
18
-
19
-
20
-
21
-
22
-
23
-
24
-
25
-
26
-
27
-
28
-
29
-
30
-
31
-
32
-
33
-
34
-
35
-
36
-
37
-
38
-
39
-
40
-
41
-
42
-
43
-
44
-
45
-
46
-
47
-
48
-
49
-
50
-
51
-
52
-
53
-
54
-
55
-
56
-
57
-
58
-
59
-
60
-
61
-
62
-
63
-
64
-
65
-
66
-
67
-
68
-
69
-
70
-
71
-
72
-
73
-
74
-
75
-
76
-
77
-
78
-
79
-
80
-
81
-
82
-
83
-
84
-
85
-
86
-
87
-
88
-
89
-
90
-
91
-
92
-
93
-
94
-
95
-
96
-
97
-
98
-
99
-
100
-
101
-
102
-
103
-
104
-
105
-
106
-
107
-
108
-
109
-
110
-
111
-
112
-
113
-
114
-
115
-
116
-
117
-
118
-
119
-
120
-
121
-
122
-
123
-
124
-
125
-
126
-
127
-
128
-
129
-
130
-
131
-
132
-
133
-
134
-
135
-
136
-
137
-
138
-
139
-
140
-
141
-
142
-
143
-
144
-
145
-
146
-
147
-
148
-
149
-
150
-
151
-
152
-
153
-
154
-
155
-
156
-
157
-
158
-
159
-
160
-
161
-
162
-
163
-
164
-
165
-
166
-
167
-
168
-
169
-
170
-
171
-
172
-
173
-
174
-
175
-
176
-
177
-
178
-
179
-
180
-
181
-
182
-
183
-
184
-
185
-
186
-
187
-
188
-
189
-
190
-
191
-
192
-
193
-
194
-
195
-
196
-
197
-
198
-
199
-
200
-
201
-
202
-
203
-
204
-
205
-
206
-
207
-
208
-
209
-
210
-
211
-
212
-
213
-
214
-
215
-
216
-
217
-
218
-
219
-
 220
220 -
 221
221 -
 222
222 -
 223
223 -
 224
224 -
 225
225 -
 226
226 -
 227
227 -
 228
228 -
 229
229 -
 230
230 -
 231
231 -
 232
232 -
 233
233 -
 234
234 -
 235
235 -
 236
236 -
 237
237 -
 238
238 -
 239
239 -
 240
240 -
241
-
242
-
243
-
244
-
245
-
246
-
247
-
248
-
249
-
250
-
251
-
252
-
253
-
254
-
255
-
256
-
257
-
258
-
259
-
260
-
261
-
262
-
263
-
264
-
265
-
266
-
267
-
268
-
269
-
270
-
271
-
272
-
273
-
274
-
275
-
276
-
277
-
278
-
279
-
280
-
281
-
282
-
283
-
284
-
285
-
286
-
287
-
288
-
289
-
290
-
291
-
292
 |
 |

COMPANY FINANCIAL STATEMENTS
6NOTES TO THE FINANCIAL STATEMENTS
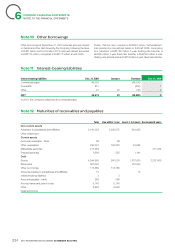
Note1
Non-current assets
1.1 - Intangible assets
This item primarily consists of share issue and merger expenses, which are fully amortised.
1.2 - Tangible assets
Tangible assets Dec. 31, 2009 Additions Disposals Dec. 31, 2010
Cost 4,481 - (1) 4,480
Depreciation (290) - - (290)
NET 4,191 - (1) 4,190
Note2
Investments
2.1 - Shares in subsidiaries and affiliates
Shares in subsidiaries and affi liates Dec. 31, 2009 Additions Disposals Dec. 31, 2010
Cost 4,608,100 4 - 4,608,104
Provisions (17,897) - - (17,897)
NET 4,590,203 4 -4,590,207
The main changes over the fi nancial year stemmed from participation in capital increases at Cofi bel and Cofi mines.
The main investments at December31, 2010 were as follows:
Shares in subsidiaries and affi liates Carrying value
Schneider Electric Industries SAS 4,344,481
Cofi bel 136,943
Cofi mines 82,614
Digital Holdings Co Ltd 21,249
Other (less than EUR20 million) 4,920
TOTAL 4,590,207
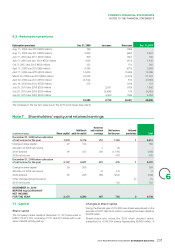
2.2 - Other investment securities
Other investment securities Dec. 31, 2009 Increases Decreases Dec. 31, 2010
Schneider Electric SA shares 48,778 - - 48,778
Other 111,303 - - 111,303
Provisions for other shares (77) - - (77)
NET 160,004 - - 160,004
Other investment securities primarily include Schneider Electric
SA shares acquired for allocation on the exercise of certain stock
options. Schneider Electric SA has not reclassifi ed own shares
allocated to this line item as of December31, 2004. However, since
then, all purchases made for allocation to stock option plans have
been classifi ed as marketable securities.
At both December31, 2010 and December31, 2009, 997,077
own shares were recognised under “Other investment securities”,
representing a gross value of EUR49million.
“Other” shares primarily consist of EUR111million of AXA shares.
The other investments included in this item have been fully written
down.
2010 REGISTRATION DOCUMENT SCHNEIDER ELECTRIC228