APC 2010 Annual Report Download - page 193
Download and view the complete annual report
Please find page 193 of the 2010 APC annual report below. You can navigate through the pages in the report by either clicking on the pages listed below, or by using the keyword search tool below to find specific information within the annual report.-
 1
1 -
2
-
3
-
4
-
5
-
6
-
7
-
8
-
9
-
10
-
11
-
12
-
13
-
14
-
15
-
16
-
17
-
18
-
19
-
20
-
21
-
22
-
23
-
24
-
25
-
26
-
27
-
28
-
29
-
30
-
31
-
32
-
33
-
34
-
35
-
36
-
37
-
38
-
39
-
40
-
41
-
42
-
43
-
44
-
45
-
46
-
47
-
48
-
49
-
50
-
51
-
52
-
53
-
54
-
55
-
56
-
57
-
58
-
59
-
60
-
61
-
62
-
63
-
64
-
65
-
66
-
67
-
68
-
69
-
70
-
71
-
72
-
73
-
74
-
75
-
76
-
77
-
78
-
79
-
80
-
81
-
82
-
83
-
84
-
85
-
86
-
87
-
88
-
89
-
90
-
91
-
92
-
93
-
94
-
95
-
96
-
97
-
98
-
99
-
100
-
101
-
102
-
103
-
104
-
105
-
106
-
107
-
108
-
109
-
110
-
111
-
112
-
113
-
114
-
115
-
116
-
117
-
118
-
119
-
120
-
121
-
122
-
123
-
124
-
125
-
126
-
127
-
128
-
129
-
130
-
131
-
132
-
133
-
134
-
135
-
136
-
137
-
138
-
139
-
140
-
141
-
142
-
143
-
144
-
145
-
146
-
147
-
148
-
149
-
150
-
151
-
152
-
153
-
154
-
155
-
156
-
157
-
158
-
159
-
160
-
161
-
162
-
163
-
164
-
165
-
166
-
167
-
168
-
169
-
170
-
171
-
172
-
173
-
174
-
175
-
176
-
177
-
178
-
179
-
180
-
181
-
182
-
 183
183 -
 184
184 -
 185
185 -
 186
186 -
 187
187 -
 188
188 -
 189
189 -
 190
190 -
 191
191 -
 192
192 -
 193
193 -
 194
194 -
 195
195 -
 196
196 -
 197
197 -
 198
198 -
 199
199 -
 200
200 -
 201
201 -
 202
202 -
 203
203 -
204
-
205
-
206
-
207
-
208
-
209
-
210
-
211
-
212
-
213
-
214
-
215
-
216
-
217
-
218
-
219
-
220
-
221
-
222
-
223
-
224
-
225
-
226
-
227
-
228
-
229
-
230
-
231
-
232
-
233
-
234
-
235
-
236
-
237
-
238
-
239
-
240
-
241
-
242
-
243
-
244
-
245
-
246
-
247
-
248
-
249
-
250
-
251
-
252
-
253
-
254
-
255
-
256
-
257
-
258
-
259
-
260
-
261
-
262
-
263
-
264
-
265
-
266
-
267
-
268
-
269
-
270
-
271
-
272
-
273
-
274
-
275
-
276
-
277
-
278
-
279
-
280
-
281
-
282
-
283
-
284
-
285
-
286
-
287
-
288
-
289
-
290
-
291
-
292
 |
 |

CONSOLIDATED FINANCIAL STATEMENTS
5
NOTES TO THE CONSOLIDATED FINANCIAL STATEMENTS
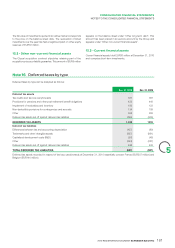
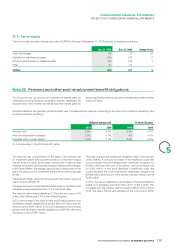
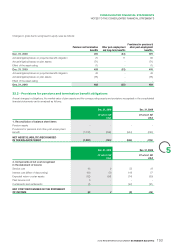
21.7 - Tax on equity
Total income tax recorded in Equity amounts to EUR200million as of December31, 2010 and can be analysed as follows:
Dec.31, 2010 Dec.31, 2009 Change in tax
Cash-fl ow hedges 69 72 (3)
Available-for-sale fi nancial assets (14) (19) 5
Actuarial gains (losses) on defi ned benefi ts 146 145 1
Other (1) (1) -
TOTAL 200 197 3
Note22
Pensions and other post-employment benefit obligations
The Group has set up various post-employment benefi t plans for
employees covering pensions, termination benefi ts, healthcare, life
insurance and other benefi ts, as well as long-term benefi t plans for
active employees, primarily long service awards and similar benefi ts,
mainly in France.
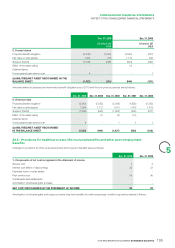
Actuarial valuations are generally performed each year. The assumptions used vary according to the economic conditions prevailing in the
country concerned, as follows:
Weighted average rate Of which US plans
2010 2009 2010 2009
Discount rate 5.0% 5.2% 5.5% 5.8%
Rate of compensation increases 2.0% 3.1% NA 4.5%
Expected return on plan assets(1) 7.0% 7.1% 8.3% 8.3%
(1) Corresponding to the 2009 and 2010 rates.
The discount rate is determined on the basis of the interest rate
for investment-grade (AA) corporate bonds or, in the event a liquid
market does not exist, government bonds with a maturity that
matches the duration of the benefi t obligation (reference: Bloomberg).
In the United States, the average discount rate is determined on the
basis of a yield curve for investment-grade (AA and AAA) corporate
bonds.
These benchmarks, which are the same as those used in previous
years, comply with IAS19.
The expected return on plan assets is determined on the basis of the
weighted average expected return of the total asset value.
The discount rate currently stands at 4.33% in the euro zone, 5.5%
in the United States and 5.4% in the United Kingdom.
A 0.5 point increase in the discount rate would reduce pension and
termination benefi t obligations by around EUR130million and the
service cost by EUR1million. A 0.5 point decrease would increase
pension and termination benefi t obligations by EUR146million and
the service cost by EUR1million.
The post-employment healthcare obligation mainly concerns the
United States. A one point increase in the healthcare costs rate
would increase the post-employment healthcare obligation by
EUR45million and the sum of the service cost and interest cost
by EUR3million. A one point decrease in healthcare costs rate
would decrease the post-employment healthcare obligation by
EUR38million and the sum of the service cost and interest cost by
EUR2million.
In 2010, the rate of healthcare cost increases in the United States is
based on a decreasing trend from 9% in 2011 to 5% in 2015. This
compares with the previous year’s forecast of 9% in 2010 to 5% in
2014. The rate in France was estimated at 4% in 2010 as in 2009.
2010 REGISTRATION DOCUMENT SCHNEIDER ELECTRIC 191