APC 2010 Annual Report Download - page 256
Download and view the complete annual report
Please find page 256 of the 2010 APC annual report below. You can navigate through the pages in the report by either clicking on the pages listed below, or by using the keyword search tool below to find specific information within the annual report.-
 1
1 -
2
-
3
-
4
-
5
-
6
-
7
-
8
-
9
-
10
-
11
-
12
-
13
-
14
-
15
-
16
-
17
-
18
-
19
-
20
-
21
-
22
-
23
-
24
-
25
-
26
-
27
-
28
-
29
-
30
-
31
-
32
-
33
-
34
-
35
-
36
-
37
-
38
-
39
-
40
-
41
-
42
-
43
-
44
-
45
-
46
-
47
-
48
-
49
-
50
-
51
-
52
-
53
-
54
-
55
-
56
-
57
-
58
-
59
-
60
-
61
-
62
-
63
-
64
-
65
-
66
-
67
-
68
-
69
-
70
-
71
-
72
-
73
-
74
-
75
-
76
-
77
-
78
-
79
-
80
-
81
-
82
-
83
-
84
-
85
-
86
-
87
-
88
-
89
-
90
-
91
-
92
-
93
-
94
-
95
-
96
-
97
-
98
-
99
-
100
-
101
-
102
-
103
-
104
-
105
-
106
-
107
-
108
-
109
-
110
-
111
-
112
-
113
-
114
-
115
-
116
-
117
-
118
-
119
-
120
-
121
-
122
-
123
-
124
-
125
-
126
-
127
-
128
-
129
-
130
-
131
-
132
-
133
-
134
-
135
-
136
-
137
-
138
-
139
-
140
-
141
-
142
-
143
-
144
-
145
-
146
-
147
-
148
-
149
-
150
-
151
-
152
-
153
-
154
-
155
-
156
-
157
-
158
-
159
-
160
-
161
-
162
-
163
-
164
-
165
-
166
-
167
-
168
-
169
-
170
-
171
-
172
-
173
-
174
-
175
-
176
-
177
-
178
-
179
-
180
-
181
-
182
-
183
-
184
-
185
-
186
-
187
-
188
-
189
-
190
-
191
-
192
-
193
-
194
-
195
-
196
-
197
-
198
-
199
-
200
-
201
-
202
-
203
-
204
-
205
-
206
-
207
-
208
-
209
-
210
-
211
-
212
-
213
-
214
-
215
-
216
-
217
-
218
-
219
-
220
-
221
-
222
-
223
-
224
-
225
-
226
-
227
-
228
-
229
-
230
-
231
-
232
-
233
-
234
-
235
-
236
-
237
-
238
-
239
-
240
-
241
-
242
-
243
-
244
-
245
-
 246
246 -
 247
247 -
 248
248 -
 249
249 -
 250
250 -
 251
251 -
 252
252 -
 253
253 -
 254
254 -
 255
255 -
 256
256 -
 257
257 -
 258
258 -
 259
259 -
 260
260 -
 261
261 -
 262
262 -
 263
263 -
 264
264 -
 265
265 -
 266
266 -
267
-
268
-
269
-
270
-
271
-
272
-
273
-
274
-
275
-
276
-
277
-
278
-
279
-
280
-
281
-
282
-
283
-
284
-
285
-
286
-
287
-
288
-
289
-
290
-
291
-
292
 |
 |

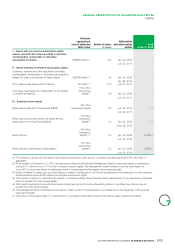
GENERAL PRESENTATION OF SCHNEIDERELECTRICSA
7STOCK OPTION AND STOCK GRANT PLANS WITHPERFORMANCE CRITERIA
Past option plans
Plan Plan date
Number of
benefi ciaries
at inception
Number of
options at
inception
o/w
corporate
offi cers
Exercise
price
(ineuros) Performance criteria
% of
targets
reached
Options
cancelled by
performance
criteria(1)
Options
outstanding at
Dec.31, 2010(2)
21 Feb.5, 2003 433 2,000,000 150,000 45.21 50% of options - 2005 net
operating profi t and return
on capital employed
84.0 141,900 44,226
22 Feb.5, 2003 111 111,000 - 45.21 Without - plan reserved to
winners of the trophy
NA NA 6,470
23 May6, 2004 107 107,000 - 55.55 Without - plan reserved to
winners of the trophy
NA NA 15,166
24 May6, 2004 402 2,060,700 150,000 55.55 50% of options -
operating margin on
revenue - 1/3 per year on
2004, 2005 and 2006
88.9 94,300 422,822
25 May12, 2005 157 138,500 - 56.47 Without - plan reserved to
winners of the trophy
NA NA 29,470
26 Jun.28, 2005 458 2,003,800 200,000 60.19 50% of options - 2005
and 2006 operating
margin and revenue
100 - 945,099
27 Dec1, 2005 419 1,614,900 150,000 71.40 50% of options - 2006
and 2007 operating
margin and revenue
100 - 1,084,196
28 Dec21, 2006 489 1,257,120 112,000 81.34 50% of options - 2007
and 2008 operating
margin and revenue
100 - 1,052,823
29 Apr.23, 2007 43 83,150 - 97.05 50% of options - 2007
and 2008 operating
margin and revenue
100 - 76,150
30 Dec.19, 2007 542 944,926 88,200 92.00 50% of options - 2008
and 2009 operating
margin and revenue
- 443,976 441,220
31 Jan.5, 2009 328 679,000 68,500 52.12 50% of options/100%
for the Management
Board - 2011 operating
margin(4) and 2009 to
2011 EPS compared to a
benchmark selection(3)
- - 643,450
32 Aug.21, 2009 1 5,000 5,000 62.61 without - - 5,000
33 Dec.21, 2009 391 826,343 65,000 75.84 50% of options/100% for
the Management Board -
2010 and 2011 operating
margin(4) and 2011 share
of revenue generated in
the new economies
- - 823,043
11,831,439 988,700 - 680,176 5,589,135
(1) Number of shares cancelled for non-achievement of targets (plans 21 to 30).
(2) Number of options outstanding after deduction of all cancellations and exercises since the plan was initiated.
(3) On the basis of a pre-defi ned and fi xed list of 11competitor companies.
(4) Excluding restructuring costs.
2010 REGISTRATION DOCUMENT SCHNEIDER ELECTRIC254