APC 2010 Annual Report Download - page 102
Download and view the complete annual report
Please find page 102 of the 2010 APC annual report below. You can navigate through the pages in the report by either clicking on the pages listed below, or by using the keyword search tool below to find specific information within the annual report.-
 1
1 -
2
-
3
-
4
-
5
-
6
-
7
-
8
-
9
-
10
-
11
-
12
-
13
-
14
-
15
-
16
-
17
-
18
-
19
-
20
-
21
-
22
-
23
-
24
-
25
-
26
-
27
-
28
-
29
-
30
-
31
-
32
-
33
-
34
-
35
-
36
-
37
-
38
-
39
-
40
-
41
-
42
-
43
-
44
-
45
-
46
-
47
-
48
-
49
-
50
-
51
-
52
-
53
-
54
-
55
-
56
-
57
-
58
-
59
-
60
-
61
-
62
-
63
-
64
-
65
-
66
-
67
-
68
-
69
-
70
-
71
-
72
-
73
-
74
-
75
-
76
-
77
-
78
-
79
-
80
-
81
-
82
-
83
-
84
-
85
-
86
-
87
-
88
-
89
-
90
-
91
-
 92
92 -
 93
93 -
 94
94 -
 95
95 -
 96
96 -
 97
97 -
 98
98 -
 99
99 -
 100
100 -
 101
101 -
 102
102 -
 103
103 -
 104
104 -
 105
105 -
 106
106 -
 107
107 -
 108
108 -
 109
109 -
 110
110 -
 111
111 -
 112
112 -
113
-
114
-
115
-
116
-
117
-
118
-
119
-
120
-
121
-
122
-
123
-
124
-
125
-
126
-
127
-
128
-
129
-
130
-
131
-
132
-
133
-
134
-
135
-
136
-
137
-
138
-
139
-
140
-
141
-
142
-
143
-
144
-
145
-
146
-
147
-
148
-
149
-
150
-
151
-
152
-
153
-
154
-
155
-
156
-
157
-
158
-
159
-
160
-
161
-
162
-
163
-
164
-
165
-
166
-
167
-
168
-
169
-
170
-
171
-
172
-
173
-
174
-
175
-
176
-
177
-
178
-
179
-
180
-
181
-
182
-
183
-
184
-
185
-
186
-
187
-
188
-
189
-
190
-
191
-
192
-
193
-
194
-
195
-
196
-
197
-
198
-
199
-
200
-
201
-
202
-
203
-
204
-
205
-
206
-
207
-
208
-
209
-
210
-
211
-
212
-
213
-
214
-
215
-
216
-
217
-
218
-
219
-
220
-
221
-
222
-
223
-
224
-
225
-
226
-
227
-
228
-
229
-
230
-
231
-
232
-
233
-
234
-
235
-
236
-
237
-
238
-
239
-
240
-
241
-
242
-
243
-
244
-
245
-
246
-
247
-
248
-
249
-
250
-
251
-
252
-
253
-
254
-
255
-
256
-
257
-
258
-
259
-
260
-
261
-
262
-
263
-
264
-
265
-
266
-
267
-
268
-
269
-
270
-
271
-
272
-
273
-
274
-
275
-
276
-
277
-
278
-
279
-
280
-
281
-
282
-
283
-
284
-
285
-
286
-
287
-
288
-
289
-
290
-
291
-
292
 |
 |

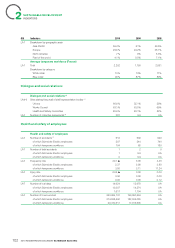
SUSTAINABLE DEVELOPMENT
2INDICATORS
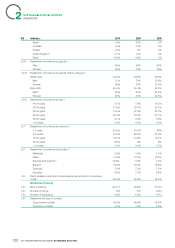
GRI Indicators 2010 2009 2008
Spain +6% -20% UA
Australia +2% -13% UA
Russia +6% -6% UA
United Kingdom +11% -11% UA
Brazil +40% +16% UA
LA13 Breakdown of workforce by gender(2)
Men 66% 66% 65%
Women 34% 34% 35%
LA13 Breakdown of workforce by gender and by category(2)
White collar 53.6% 54.6% 55.6%
Men 71% 72% 72.6%
Women 29% 28% 27.4%
Blue collar 46.4% 45.4% 44.4%
Men** 60% 60% 57.4%
Women 40% 40% 42.6%
LA13 Breakdown of workforce by age(2)
14/24years 8.7% 7.9% 10.7%
25/34years 31.4% 30.7% 32.1%
35/44years 27.5% 27.9% 27.2%
45/54years 22.3% 23.3% 21.1%
55/64years 9.7% 9.8% 8.5%
> 64years 0.4% 0.5% 0.4%
LA1 Breakdown of workforce by seniority(2)
< 5years 43.9% 44.7% 50%
5/14years 30.4% 29.2% 27.2%
15/24years 13.7% 13.9% 12.1%
25/34years 8.6% 9% 8%
> 34years 3.4% 3.2% 2.7%
LA1 Breakdown of workforce by function(2)
Marketing 3.8% 3.9% 4.1%
Sales 14.9% 17.2% 16.9%
Services and projects** 12.9%, 9.5% 7.7%
Support 16.8% 16.3% 16.4%
Technical 7.6% 7.2% 7.1%
Industrial 6.6% 7.6% 8.4%
LA1 Direct variable costs (cost of employees under production or business
costs) 46.4% 45.4% 44.4%
Workforce (France)
LA1 Spot workforce 20,311 18,698 19,776
LA1 Number of hirings 793 379 1,503
LA1 Number of departures 1,228 1,330 1,973
LA1 Breakdown by type of contract
Open-ended contract 95.6% 96.6% 95.2%
Fixed-term contract 4.4% 3.4% 4.8%
2010 REGISTRATION DOCUMENT SCHNEIDER ELECTRIC100