APC 2010 Annual Report Download - page 148
Download and view the complete annual report
Please find page 148 of the 2010 APC annual report below. You can navigate through the pages in the report by either clicking on the pages listed below, or by using the keyword search tool below to find specific information within the annual report.-
 1
1 -
2
-
3
-
4
-
5
-
6
-
7
-
8
-
9
-
10
-
11
-
12
-
13
-
14
-
15
-
16
-
17
-
18
-
19
-
20
-
21
-
22
-
23
-
24
-
25
-
26
-
27
-
28
-
29
-
30
-
31
-
32
-
33
-
34
-
35
-
36
-
37
-
38
-
39
-
40
-
41
-
42
-
43
-
44
-
45
-
46
-
47
-
48
-
49
-
50
-
51
-
52
-
53
-
54
-
55
-
56
-
57
-
58
-
59
-
60
-
61
-
62
-
63
-
64
-
65
-
66
-
67
-
68
-
69
-
70
-
71
-
72
-
73
-
74
-
75
-
76
-
77
-
78
-
79
-
80
-
81
-
82
-
83
-
84
-
85
-
86
-
87
-
88
-
89
-
90
-
91
-
92
-
93
-
94
-
95
-
96
-
97
-
98
-
99
-
100
-
101
-
102
-
103
-
104
-
105
-
106
-
107
-
108
-
109
-
110
-
111
-
112
-
113
-
114
-
115
-
116
-
117
-
118
-
119
-
120
-
121
-
122
-
123
-
124
-
125
-
126
-
127
-
128
-
129
-
130
-
131
-
132
-
133
-
134
-
135
-
136
-
137
-
 138
138 -
 139
139 -
 140
140 -
 141
141 -
 142
142 -
 143
143 -
 144
144 -
 145
145 -
 146
146 -
 147
147 -
 148
148 -
 149
149 -
 150
150 -
 151
151 -
 152
152 -
 153
153 -
 154
154 -
 155
155 -
 156
156 -
 157
157 -
 158
158 -
159
-
160
-
161
-
162
-
163
-
164
-
165
-
166
-
167
-
168
-
169
-
170
-
171
-
172
-
173
-
174
-
175
-
176
-
177
-
178
-
179
-
180
-
181
-
182
-
183
-
184
-
185
-
186
-
187
-
188
-
189
-
190
-
191
-
192
-
193
-
194
-
195
-
196
-
197
-
198
-
199
-
200
-
201
-
202
-
203
-
204
-
205
-
206
-
207
-
208
-
209
-
210
-
211
-
212
-
213
-
214
-
215
-
216
-
217
-
218
-
219
-
220
-
221
-
222
-
223
-
224
-
225
-
226
-
227
-
228
-
229
-
230
-
231
-
232
-
233
-
234
-
235
-
236
-
237
-
238
-
239
-
240
-
241
-
242
-
243
-
244
-
245
-
246
-
247
-
248
-
249
-
250
-
251
-
252
-
253
-
254
-
255
-
256
-
257
-
258
-
259
-
260
-
261
-
262
-
263
-
264
-
265
-
266
-
267
-
268
-
269
-
270
-
271
-
272
-
273
-
274
-
275
-
276
-
277
-
278
-
279
-
280
-
281
-
282
-
283
-
284
-
285
-
286
-
287
-
288
-
289
-
290
-
291
-
292
 |
 |

BUSINESS REVIEW
4REVIEW OF THE PARENT COMPANY FINANCIAL STATEMENTS
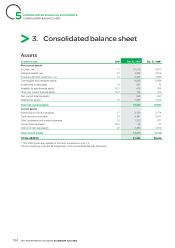
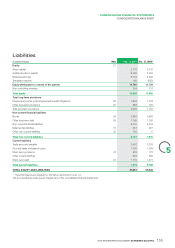
Net debt at December31, 2010 totaled EUR2,736 million or 18.2%
of equity attributable to equity holders of the parent. This represents
a small decrease of EUR76 million from the year before.
The Group ended the year with cash and cash equivalents of
EUR3,389 million, of which EUR1,449 million in cash, EUR1,825
million in marketable securities and EUR115 million in short-term
negotiable instruments such as commercial paper, money market
mutual funds and equivalents.
Total current and non-current financial liabilities amounted to
EUR6,125 million. Of this, bonds represented EUR4,348 million
and bank loans EUR1,379 million. Three new bond issues, in an
aggregate amount of EUR1,000 million, were launched in 2010, while
EUR900 million worth of bonds were redeemed and EUR263 million
worth of bonds were redeemed early.
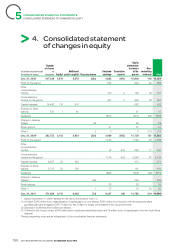
Equity
As at December31, 2010 equity attributable to equity holders of the
parent company came to EUR14,785 million, or 48% of the balance
sheet total. The EUR3,056 million increase over the period was the
net result of the following:
•profi t for the year of EUR1,720 million,
•payment of the 2009 dividend in an amount of EUR525 million,
•foreign exchange differences in an amount of EUR933 million,
•share issues for EUR474 million, of which EUR330 million in
connection with the dividend reinvestment program,
•the exercise of stock options for EUR161 million,
•disposal of own shares for EUR249 million,
Minority interests amounted to EUR204 million, up EUR73 million
compared with December31, 2009 given the EUR76 million profi t
for the year, the minority interest in Areva Distribution (EUR36 million)
and dividend payments of EUR46 million.
Provisions
Current and non-current provisions totaled EUR2,968 million, or 10%
of the balance sheet total, of which EUR1,031 million covered items
that are expected to be paid out in less than one year. This item
primarily comprises provisions for pensions and healthcare costs in
an amount of EUR1,504 million. The EUR125 million increase over
the year principally corresponds to conversion differences (EUR69
million) and the acquisitions of the period (EUR63 million) including
Areva Distribution.
Other provisions excluding employee benefi ts totaled EUR1,464
million at December31, 2010. These provisions cover economic
risks (tax risks, fi nancial risks generally corresponding to seller’s
warranties) for EUR614 million, product risks (warranties, disputes
over identifi ed defective products) for EUR409 million, restructuring
for EUR124 million, customer risks (customer disputes and losses
on long-term contracts) for EUR86 million and environmental risks for
EUR55 million. The EUR316 million increase over the year principally
corresponds to the acquisitions of the period (EUR299 million), the
most important of which was Areva Distribution.
Deferred taxes
Deferred tax assets came to EUR1,023 million as at December31,
2010, refl ecting unused tax losses of an amount of EUR387 million,
future tax savings on provisions for pensions of an amount of
EUR423 million, and non-deductible provisions and accruals of an
amount of EUR317 million.
Deferred tax liabilities totaled EUR957 million and primarily comprised
deferred taxes recognised on trademarks, customer lists and patents
acquired in connection with business combinations.
>
3. Review of the parent company
financial statements
Schneider Electric SA posted total portfolio revenues of EUR691
million in 2010 compared with EUR541 million the previous year.
Schneider Electric Industries SAS, the main subsidiary, paid dividends
of EUR672 million in 2010 compared with EUR527 million in 2009.
Interest income amounted to EUR143 million versus EUR183 million
the year before and interest expense came to EUR320 million
compared with EUR321 million in 2009. Profi t before tax amounted
to EUR497 million versus EUR386 million in 2009.
Net profi t stood at EUR703 million compared with EUR476 million
in 2009.
Equity before appropriation of net profi t amounted to EUR9,738
million at December31, 2010 versus EUR8,930 million at the
previous year-end, after taking into account 2010 profi t, dividend
payments of EUR199 million and share issues in an amount of
EUR304 million.
All trade payables are due before end-January.
2010 REGISTRATION DOCUMENT SCHNEIDER ELECTRIC146