APC 2010 Annual Report Download - page 105
Download and view the complete annual report
Please find page 105 of the 2010 APC annual report below. You can navigate through the pages in the report by either clicking on the pages listed below, or by using the keyword search tool below to find specific information within the annual report.-
 1
1 -
2
-
3
-
4
-
5
-
6
-
7
-
8
-
9
-
10
-
11
-
12
-
13
-
14
-
15
-
16
-
17
-
18
-
19
-
20
-
21
-
22
-
23
-
24
-
25
-
26
-
27
-
28
-
29
-
30
-
31
-
32
-
33
-
34
-
35
-
36
-
37
-
38
-
39
-
40
-
41
-
42
-
43
-
44
-
45
-
46
-
47
-
48
-
49
-
50
-
51
-
52
-
53
-
54
-
55
-
56
-
57
-
58
-
59
-
60
-
61
-
62
-
63
-
64
-
65
-
66
-
67
-
68
-
69
-
70
-
71
-
72
-
73
-
74
-
75
-
76
-
77
-
78
-
79
-
80
-
81
-
82
-
83
-
84
-
85
-
86
-
87
-
88
-
89
-
90
-
91
-
92
-
93
-
94
-
 95
95 -
 96
96 -
 97
97 -
 98
98 -
 99
99 -
 100
100 -
 101
101 -
 102
102 -
 103
103 -
 104
104 -
 105
105 -
 106
106 -
 107
107 -
 108
108 -
 109
109 -
 110
110 -
 111
111 -
 112
112 -
 113
113 -
 114
114 -
 115
115 -
116
-
117
-
118
-
119
-
120
-
121
-
122
-
123
-
124
-
125
-
126
-
127
-
128
-
129
-
130
-
131
-
132
-
133
-
134
-
135
-
136
-
137
-
138
-
139
-
140
-
141
-
142
-
143
-
144
-
145
-
146
-
147
-
148
-
149
-
150
-
151
-
152
-
153
-
154
-
155
-
156
-
157
-
158
-
159
-
160
-
161
-
162
-
163
-
164
-
165
-
166
-
167
-
168
-
169
-
170
-
171
-
172
-
173
-
174
-
175
-
176
-
177
-
178
-
179
-
180
-
181
-
182
-
183
-
184
-
185
-
186
-
187
-
188
-
189
-
190
-
191
-
192
-
193
-
194
-
195
-
196
-
197
-
198
-
199
-
200
-
201
-
202
-
203
-
204
-
205
-
206
-
207
-
208
-
209
-
210
-
211
-
212
-
213
-
214
-
215
-
216
-
217
-
218
-
219
-
220
-
221
-
222
-
223
-
224
-
225
-
226
-
227
-
228
-
229
-
230
-
231
-
232
-
233
-
234
-
235
-
236
-
237
-
238
-
239
-
240
-
241
-
242
-
243
-
244
-
245
-
246
-
247
-
248
-
249
-
250
-
251
-
252
-
253
-
254
-
255
-
256
-
257
-
258
-
259
-
260
-
261
-
262
-
263
-
264
-
265
-
266
-
267
-
268
-
269
-
270
-
271
-
272
-
273
-
274
-
275
-
276
-
277
-
278
-
279
-
280
-
281
-
282
-
283
-
284
-
285
-
286
-
287
-
288
-
289
-
290
-
291
-
292
 |
 |

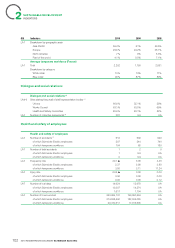
SUSTAINABLE DEVELOPMENT
INDICATORS
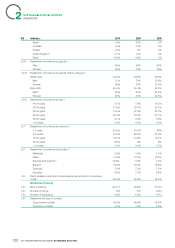
GRI Indicators 2010 2009 2008
Talent development and training
(8)
LA10 Number of training hours 2,088,144▲UA UA
LA10 Average hours of training per person(2) 22.6 24.3 28.6
White collar 30.8 28.9 36.5
Blue collar 14.3 19.4 19.9
LA10 Breakdown of hours by category(2)
White collar 68.6% 61.8% 68%
Blue collar* 31.4% 38.2% 32%
LA10 Breakdown of hours by training type(2)
Health, safety, environment 11.9% 12.5% 15.1%
Technical 32.7% 35.6% 35.5%
Languages, IT 18.2% 17.7% 20.4%
Management and leadership 16.7% 15.1% 13.6%
Other 20.6% 19.1% 15.4%
LA10 Breakdown of costs by training type(2)
Health, safety, environment 11.8% 9.9% 8.2%
Technical 43.2% 33.5% 27.5%
Languages, IT 10.5% 14.9% 17.8%
Management and leadership 18.4% 26.2% 25.6%
Other 16.1% 15.5% 20.9%
LA10 Breakdown of costs by category(2)
White collar 68.0% 75.5% 77.5%
Blue collar 32.0% 24.5% 22.5%
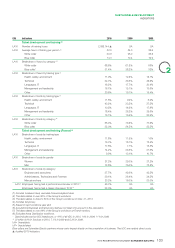
Talent development and training (France)
(8)
LA10 Breakdown of costs by training type
Health, safety, environment 11.8% 11.5% 10%
Technical 16.7% 18.1% 12.5%
Languages, IT 17.8% 7.1% 18.8%
Management and leadership 14.2% 25.6% 21.5%
Other 9.9% 13.1% 10.7%
LA10 Breakdown of costs by gender
Women 27.2% 25.0% 27.2%
Men 72.8% 75.0% 72.8%
LA10 Breakdown of costs by category
Engineers and executives 37.7% 45.6% 42.5%
Administrators, Technicians and Foremen 39.1% 38.4% 34.5%
Manual workers 23.2% 16.0% 23.0%
LA12 Employees having had a performance interview in 2010(3) 46.7% UA UA
Employees having had a career interview in 2010(3) 32.0% UA UA
(1) Includes business travel, excludes home/workplace travel.
(2) The data relates to over 80% of the Group’s workforce.
(3) The data relates to close to 80% of the Group’s workforce on Dec. 31, 2010.
(4) Includes temporary.
(5) Based on spot workforce year end.
(6) Acquisitions/disposals and temporary staff are not taken into account in the calculation.
(7) The data relates to over 94% of the Group’s workforce on French territory.
(8) Excludes Areva Distribution workforce.
* Data includes service VDC headcount, or 19% of all VDC in 2010, 16% in 2009, 11% in 2008.
** Of which 8.9% in Services in 2010, 7.1% in 2009 and 5.2% in 2008.
UA = Unavailable.
UP = Unpublished.
Blue collars are Schneider Electric partners whose costs impact directly on the completion of business. The VDC are variable direct costs.
▲ Audited 2010 indicators.
2010 REGISTRATION DOCUMENT SCHNEIDER ELECTRIC 103
2