APC 2010 Annual Report Download - page 11
Download and view the complete annual report
Please find page 11 of the 2010 APC annual report below. You can navigate through the pages in the report by either clicking on the pages listed below, or by using the keyword search tool below to find specific information within the annual report.-
 1
1 -
 2
2 -
 3
3 -
 4
4 -
 5
5 -
 6
6 -
 7
7 -
 8
8 -
 9
9 -
 10
10 -
 11
11 -
 12
12 -
 13
13 -
 14
14 -
 15
15 -
 16
16 -
 17
17 -
 18
18 -
 19
19 -
 20
20 -
 21
21 -
 22
22 -
23
-
24
-
25
-
26
-
27
-
28
-
29
-
30
-
31
-
32
-
33
-
34
-
35
-
36
-
37
-
38
-
39
-
40
-
41
-
42
-
43
-
44
-
45
-
46
-
47
-
48
-
49
-
50
-
51
-
52
-
53
-
54
-
55
-
56
-
57
-
58
-
59
-
60
-
61
-
62
-
63
-
64
-
65
-
66
-
67
-
68
-
69
-
70
-
71
-
72
-
73
-
74
-
75
-
76
-
77
-
78
-
79
-
80
-
81
-
82
-
83
-
84
-
85
-
86
-
87
-
88
-
89
-
90
-
91
-
92
-
93
-
94
-
95
-
96
-
97
-
98
-
99
-
100
-
101
-
102
-
103
-
104
-
105
-
106
-
107
-
108
-
109
-
110
-
111
-
112
-
113
-
114
-
115
-
116
-
117
-
118
-
119
-
120
-
121
-
122
-
123
-
124
-
125
-
126
-
127
-
128
-
129
-
130
-
131
-
132
-
133
-
134
-
135
-
136
-
137
-
138
-
139
-
140
-
141
-
142
-
143
-
144
-
145
-
146
-
147
-
148
-
149
-
150
-
151
-
152
-
153
-
154
-
155
-
156
-
157
-
158
-
159
-
160
-
161
-
162
-
163
-
164
-
165
-
166
-
167
-
168
-
169
-
170
-
171
-
172
-
173
-
174
-
175
-
176
-
177
-
178
-
179
-
180
-
181
-
182
-
183
-
184
-
185
-
186
-
187
-
188
-
189
-
190
-
191
-
192
-
193
-
194
-
195
-
196
-
197
-
198
-
199
-
200
-
201
-
202
-
203
-
204
-
205
-
206
-
207
-
208
-
209
-
210
-
211
-
212
-
213
-
214
-
215
-
216
-
217
-
218
-
219
-
220
-
221
-
222
-
223
-
224
-
225
-
226
-
227
-
228
-
229
-
230
-
231
-
232
-
233
-
234
-
235
-
236
-
237
-
238
-
239
-
240
-
241
-
242
-
243
-
244
-
245
-
246
-
247
-
248
-
249
-
250
-
251
-
252
-
253
-
254
-
255
-
256
-
257
-
258
-
259
-
260
-
261
-
262
-
263
-
264
-
265
-
266
-
267
-
268
-
269
-
270
-
271
-
272
-
273
-
274
-
275
-
276
-
277
-
278
-
279
-
280
-
281
-
282
-
283
-
284
-
285
-
286
-
287
-
288
-
289
-
290
-
291
-
292
 |
 |

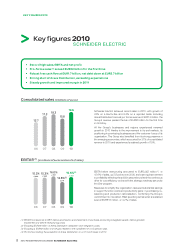
2010 REGISTRATION DOCUMENT SCHNEIDER ELECTRIC 9
KEY FIGURES 2010
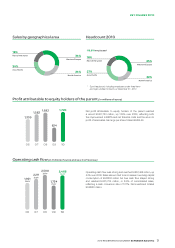
Sales by geographical area
18%
Rest of the world
24%
Asia-Pacific
34%
Western Europe
24%
North America
Profit attributable to equity holders of the parent (in millions of euros)
06
1,309
10
1,720
07
1,583
08
1,682
09
824
Net profi t attributable to equity holders of the parent reached
a record EUR1,720 million, up 109% over 2009, refl ecting both
the improvement in EBITA and net fi nancial costs and the return to
profi t of associates. Earnings per share totaled EUR6.59.
Operating cash flow (in millions of euros and as a % of revenue)
06 1007 08 09
1,921
14.0%
2,211
12.8%
2,500
13.7%
1,734
11.0%
2,468
12.6%
Operating cash fl ow was strong and reached EUR2,468million, up
44% over 2009. Sales rebound led to an increase in working capital
consumption of EUR206 million but free cash fl ow stayed strong
and reached EUR1,734 million, or 8.9% of consolidated sales,
refl ecting a cash conversion rate of 101%. Net investment totaled
EUR528million.
Headcount 2010
16%
Rest of the world
27%
Asia-Pacific
35%
Western Europe
22%
North America
* Spot headcount, including employees under fixed-term
and open-ended contracts, at December 31, 2010
118,819 employees*