APC 2010 Annual Report Download - page 260
Download and view the complete annual report
Please find page 260 of the 2010 APC annual report below. You can navigate through the pages in the report by either clicking on the pages listed below, or by using the keyword search tool below to find specific information within the annual report.-
 1
1 -
2
-
3
-
4
-
5
-
6
-
7
-
8
-
9
-
10
-
11
-
12
-
13
-
14
-
15
-
16
-
17
-
18
-
19
-
20
-
21
-
22
-
23
-
24
-
25
-
26
-
27
-
28
-
29
-
30
-
31
-
32
-
33
-
34
-
35
-
36
-
37
-
38
-
39
-
40
-
41
-
42
-
43
-
44
-
45
-
46
-
47
-
48
-
49
-
50
-
51
-
52
-
53
-
54
-
55
-
56
-
57
-
58
-
59
-
60
-
61
-
62
-
63
-
64
-
65
-
66
-
67
-
68
-
69
-
70
-
71
-
72
-
73
-
74
-
75
-
76
-
77
-
78
-
79
-
80
-
81
-
82
-
83
-
84
-
85
-
86
-
87
-
88
-
89
-
90
-
91
-
92
-
93
-
94
-
95
-
96
-
97
-
98
-
99
-
100
-
101
-
102
-
103
-
104
-
105
-
106
-
107
-
108
-
109
-
110
-
111
-
112
-
113
-
114
-
115
-
116
-
117
-
118
-
119
-
120
-
121
-
122
-
123
-
124
-
125
-
126
-
127
-
128
-
129
-
130
-
131
-
132
-
133
-
134
-
135
-
136
-
137
-
138
-
139
-
140
-
141
-
142
-
143
-
144
-
145
-
146
-
147
-
148
-
149
-
150
-
151
-
152
-
153
-
154
-
155
-
156
-
157
-
158
-
159
-
160
-
161
-
162
-
163
-
164
-
165
-
166
-
167
-
168
-
169
-
170
-
171
-
172
-
173
-
174
-
175
-
176
-
177
-
178
-
179
-
180
-
181
-
182
-
183
-
184
-
185
-
186
-
187
-
188
-
189
-
190
-
191
-
192
-
193
-
194
-
195
-
196
-
197
-
198
-
199
-
200
-
201
-
202
-
203
-
204
-
205
-
206
-
207
-
208
-
209
-
210
-
211
-
212
-
213
-
214
-
215
-
216
-
217
-
218
-
219
-
220
-
221
-
222
-
223
-
224
-
225
-
226
-
227
-
228
-
229
-
230
-
231
-
232
-
233
-
234
-
235
-
236
-
237
-
238
-
239
-
240
-
241
-
242
-
243
-
244
-
245
-
246
-
247
-
248
-
249
-
 250
250 -
 251
251 -
 252
252 -
 253
253 -
 254
254 -
 255
255 -
 256
256 -
 257
257 -
 258
258 -
 259
259 -
 260
260 -
 261
261 -
 262
262 -
 263
263 -
 264
264 -
 265
265 -
 266
266 -
 267
267 -
 268
268 -
 269
269 -
 270
270 -
271
-
272
-
273
-
274
-
275
-
276
-
277
-
278
-
279
-
280
-
281
-
282
-
283
-
284
-
285
-
286
-
287
-
288
-
289
-
290
-
291
-
292
 |
 |

GENERAL PRESENTATION OF SCHNEIDERELECTRICSA
7STOCK MARKET DATA
>
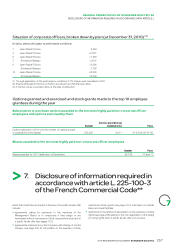
8. Stock market data
In France, Schneider Electric is listed on the Eurolist of the Euronext Paris market (compartment A), where it is traded in lots of one under
ISIN code FR0000121972. It is part of the market’s benchmark CAC40 index of France’s largest stocks.
Five-year trading summary
2010 2009 2008 2007 2006
Average daily trading volume Euronext Paris(1):
• thousands of shares 1,231.29 1,323.58 1,691.19 1,587.79 1,058.43
• millions of euros 108.23 77.12 115.18 152.00 88.86
High and low share prices (ineuros):
• high 120.00 81.85 94.29 110.26 93.40
• low 72.00 41.30 38.84 83.51 70.85
Year-end closing price (ineuros) 112.00 81.78 53.00 92.68 84.10
Yield including tax credit(%) 2.86 2.51 6.50 3.56 3.57
(1) Corresponds to trading volume on NYSE Euronext.
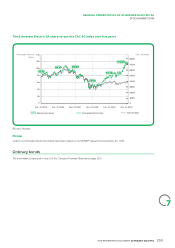
18-month trading data
Year Month Trading volume (in
thousands)(2)
Value (in millions of
euros)
Highs and lows (ineuros)(3)
High Low
2009 August 20,722 1,335 67.96 61.45
September 26,642 1,844 74.05 61.98
October 26,709 1,921 77.40 65.93
November 19,586 1,455 76.97 69.61
December 17,652 1,348 81.85 74.08
2010 January 19,965 1,569 82.74 73.75
February 25,015 1,911 81.86 72.00
March 24,979 2,093 87.45 78.58
April 27,005 2,346 89.48 82.66
May 50,144 4,029 86.47 73.95
June 33,855 2,944 93.60 79.46
July 27,571 2,358 90.70 79.70
August 22,670 1,989 93.45 81.40
September 25,932 2,338 94.95 81.60
October 25,714 2,535 103.85 91.42
November 17,837 1,899 113.75 100.85
December 16,984 1,911 120.00 109.30
TOTAL 2010 317,672 27,922
2011 January 17,543 2,008 119.35 108.35
(2) Corresponds to trading volume on NYSE Euronext.
(3) During the trading session.
2010 REGISTRATION DOCUMENT SCHNEIDER ELECTRIC258