APC 2010 Annual Report Download - page 101
Download and view the complete annual report
Please find page 101 of the 2010 APC annual report below. You can navigate through the pages in the report by either clicking on the pages listed below, or by using the keyword search tool below to find specific information within the annual report.-
 1
1 -
2
-
3
-
4
-
5
-
6
-
7
-
8
-
9
-
10
-
11
-
12
-
13
-
14
-
15
-
16
-
17
-
18
-
19
-
20
-
21
-
22
-
23
-
24
-
25
-
26
-
27
-
28
-
29
-
30
-
31
-
32
-
33
-
34
-
35
-
36
-
37
-
38
-
39
-
40
-
41
-
42
-
43
-
44
-
45
-
46
-
47
-
48
-
49
-
50
-
51
-
52
-
53
-
54
-
55
-
56
-
57
-
58
-
59
-
60
-
61
-
62
-
63
-
64
-
65
-
66
-
67
-
68
-
69
-
70
-
71
-
72
-
73
-
74
-
75
-
76
-
77
-
78
-
79
-
80
-
81
-
82
-
83
-
84
-
85
-
86
-
87
-
88
-
89
-
90
-
 91
91 -
 92
92 -
 93
93 -
 94
94 -
 95
95 -
 96
96 -
 97
97 -
 98
98 -
 99
99 -
 100
100 -
 101
101 -
 102
102 -
 103
103 -
 104
104 -
 105
105 -
 106
106 -
 107
107 -
 108
108 -
 109
109 -
 110
110 -
 111
111 -
112
-
113
-
114
-
115
-
116
-
117
-
118
-
119
-
120
-
121
-
122
-
123
-
124
-
125
-
126
-
127
-
128
-
129
-
130
-
131
-
132
-
133
-
134
-
135
-
136
-
137
-
138
-
139
-
140
-
141
-
142
-
143
-
144
-
145
-
146
-
147
-
148
-
149
-
150
-
151
-
152
-
153
-
154
-
155
-
156
-
157
-
158
-
159
-
160
-
161
-
162
-
163
-
164
-
165
-
166
-
167
-
168
-
169
-
170
-
171
-
172
-
173
-
174
-
175
-
176
-
177
-
178
-
179
-
180
-
181
-
182
-
183
-
184
-
185
-
186
-
187
-
188
-
189
-
190
-
191
-
192
-
193
-
194
-
195
-
196
-
197
-
198
-
199
-
200
-
201
-
202
-
203
-
204
-
205
-
206
-
207
-
208
-
209
-
210
-
211
-
212
-
213
-
214
-
215
-
216
-
217
-
218
-
219
-
220
-
221
-
222
-
223
-
224
-
225
-
226
-
227
-
228
-
229
-
230
-
231
-
232
-
233
-
234
-
235
-
236
-
237
-
238
-
239
-
240
-
241
-
242
-
243
-
244
-
245
-
246
-
247
-
248
-
249
-
250
-
251
-
252
-
253
-
254
-
255
-
256
-
257
-
258
-
259
-
260
-
261
-
262
-
263
-
264
-
265
-
266
-
267
-
268
-
269
-
270
-
271
-
272
-
273
-
274
-
275
-
276
-
277
-
278
-
279
-
280
-
281
-
282
-
283
-
284
-
285
-
286
-
287
-
288
-
289
-
290
-
291
-
292
 |
 |

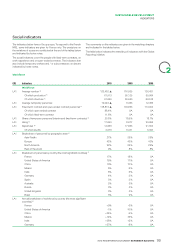
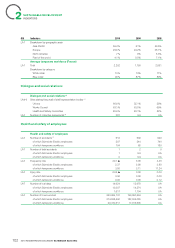
SUSTAINABLE DEVELOPMENT
INDICATORS
Social indicators
The indicators below have a Group scope. To respond to the French
NRE, some indicators are given for France only. The precisions on
the variations of scope are contributed at the end of the tables below
and indicated by footer notes.
The social indicators count the people with fi xed-term contracts, on
work-experience and on open-ended contracts. The indicators that
also include temporary workers and / or subcontractors on site are
indicated by footer notes.
The comments on the indicators are given in the matching chapters
and indicated in the tables below.
The table below indicates the matching of indicators with the Global
Reporting initiative.
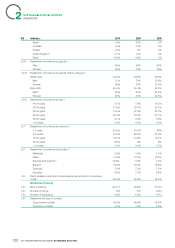
Workforce
GRI Indicators 2010 2009 2008
Workforce
LA1 Average number(4) 123,482 ▲116,065 126,481
Of which production(4) 61,913 55,125 59,964
Of which structure(4) 61,569 60,940 66,518
LA1 Average temporary personnel 12,049 ▲8,463 12,365
LA1 Fixed-term contract and open-ended contract personnel(5) 118,819 ▲104,853 113,904
Of which open-ended contract 88.4% UA UA
Of which fi xed-term contract 11.6% UA UA
LA1 Share of temporary personnel (interim and fi xed-term contracts)(5) 20.8% 18.9% 18.7%
LA1 Hiring(6) 17,590 8,977 20,995
LA1 Departures(6) 14,968 17,663 21,504
Of which layoffs 3,976 6,331 5,053
LA1 Breakdown of personnel by geographic area(5)
Asia-Pacifi c 27% 25% 25%
Europe 42% 43% 42%
North America 22% 24% 25%
Rest of the world 9% 8% 8%
LA1 Breakdown of personnel by country (the most signifi cant countries)(5)
France 17% 18% UA
United States of America 15% 17% UA
China 10% 10% UA
Mexico 6% 6% UA
India 6% 5% UA
Germany 4% 3% UA
Spain 3% 3% UA
Australia 3% 3% UA
Russia 3% 3% UA
United Kingdom 3% 3% UA
Brazil 3% 2% UA
LA1 Annual breakdown of workforce by country (the most signifi cant
countries)(5)
France +9% -6% UA
United States of America -1% -10% UA
China +24% -9% UA
Mexico +14% -16% UA
India +38% +2% UA
Germany +57% -8% UA
2010 REGISTRATION DOCUMENT SCHNEIDER ELECTRIC 99
2