APC 2010 Annual Report Download - page 95
Download and view the complete annual report
Please find page 95 of the 2010 APC annual report below. You can navigate through the pages in the report by either clicking on the pages listed below, or by using the keyword search tool below to find specific information within the annual report.-
 1
1 -
2
-
3
-
4
-
5
-
6
-
7
-
8
-
9
-
10
-
11
-
12
-
13
-
14
-
15
-
16
-
17
-
18
-
19
-
20
-
21
-
22
-
23
-
24
-
25
-
26
-
27
-
28
-
29
-
30
-
31
-
32
-
33
-
34
-
35
-
36
-
37
-
38
-
39
-
40
-
41
-
42
-
43
-
44
-
45
-
46
-
47
-
48
-
49
-
50
-
51
-
52
-
53
-
54
-
55
-
56
-
57
-
58
-
59
-
60
-
61
-
62
-
63
-
64
-
65
-
66
-
67
-
68
-
69
-
70
-
71
-
72
-
73
-
74
-
75
-
76
-
77
-
78
-
79
-
80
-
81
-
82
-
83
-
84
-
 85
85 -
 86
86 -
 87
87 -
 88
88 -
 89
89 -
 90
90 -
 91
91 -
 92
92 -
 93
93 -
 94
94 -
 95
95 -
 96
96 -
 97
97 -
 98
98 -
 99
99 -
 100
100 -
 101
101 -
 102
102 -
 103
103 -
 104
104 -
 105
105 -
106
-
107
-
108
-
109
-
110
-
111
-
112
-
113
-
114
-
115
-
116
-
117
-
118
-
119
-
120
-
121
-
122
-
123
-
124
-
125
-
126
-
127
-
128
-
129
-
130
-
131
-
132
-
133
-
134
-
135
-
136
-
137
-
138
-
139
-
140
-
141
-
142
-
143
-
144
-
145
-
146
-
147
-
148
-
149
-
150
-
151
-
152
-
153
-
154
-
155
-
156
-
157
-
158
-
159
-
160
-
161
-
162
-
163
-
164
-
165
-
166
-
167
-
168
-
169
-
170
-
171
-
172
-
173
-
174
-
175
-
176
-
177
-
178
-
179
-
180
-
181
-
182
-
183
-
184
-
185
-
186
-
187
-
188
-
189
-
190
-
191
-
192
-
193
-
194
-
195
-
196
-
197
-
198
-
199
-
200
-
201
-
202
-
203
-
204
-
205
-
206
-
207
-
208
-
209
-
210
-
211
-
212
-
213
-
214
-
215
-
216
-
217
-
218
-
219
-
220
-
221
-
222
-
223
-
224
-
225
-
226
-
227
-
228
-
229
-
230
-
231
-
232
-
233
-
234
-
235
-
236
-
237
-
238
-
239
-
240
-
241
-
242
-
243
-
244
-
245
-
246
-
247
-
248
-
249
-
250
-
251
-
252
-
253
-
254
-
255
-
256
-
257
-
258
-
259
-
260
-
261
-
262
-
263
-
264
-
265
-
266
-
267
-
268
-
269
-
270
-
271
-
272
-
273
-
274
-
275
-
276
-
277
-
278
-
279
-
280
-
281
-
282
-
283
-
284
-
285
-
286
-
287
-
288
-
289
-
290
-
291
-
292
 |
 |

SUSTAINABLE DEVELOPMENT
METHODOLOGY ANDAUDIT OFINDICATORS
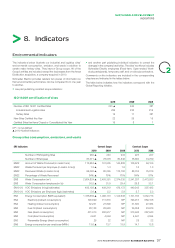
GRI Index Pages
4.17 Key questions and concerns raised via dialogue with the stakeholders 79, 75, 19
Performance indicators
Economic performance indicators
EC1 Direct economic value Strategy and SD report
EC2 Financial implications of climate change 16-26 (25-26), 30
EC3 Cover of obligations arising from benefi t plans 164, 191-192
EC8 Investments in infrastructure development 21
EC9 Description of signifi cant indirect economic impacts 16-26, 80-88
Environmental performance indicators
EN3 Direct use of energy by primary energy source 97
EN4 Indirect use of energy by primary energy source 97
EN5 Energy saved thanks to energy effi ciency 97
EN6 Initiatives aimed at increasing the energy return or the use of renewable energy 25-26, 30-32, 54-58
EN7 Initiatives to reduce the use of indirect energy and reductions obtained 66-67
EN8 Total water use by source 97
EN16 Direct and indirect emissions of greenhouse gas 98
EN17 Other indirect emissions of greenhouse gas 98
EN18 Initiatives to reduce greenhouse gas emissions 64-65
EN19 Emissions of ozone depleting substances 97
EN20 Airborne emissions of NOx, Sox by type and weight 97
EN22 Total mass of waste by type and by processing method 97
EN23 Total and volume of accidental waste 71
EN26 Initiatives to reduce environmental impact 62-71
EN28 Monetary of value of signifi cant fi nes 42, 71
Social performance indicators
Labor practices and decent work
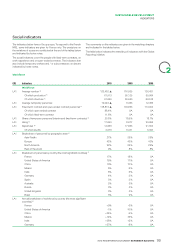
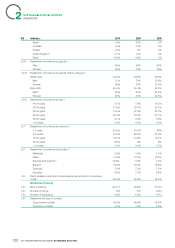
LA1 Total staff by job, contract type, and by geographic area 99-102
LA2 Staff turnover 101
LA4employees covered by collective agreements 102
LA6 Percentage of total staff in joint committees 102
LA7 Percentage of industrial accidents, occupational illnesses, working days lost and absenteeism rate 102
LA10 Training by categories of employees 103
LA11 Skills development programs and training 75-76
LA12 Percentage of employees benefi ting from review and periodic career development interviews 103
LA13 Gender breakdown in the governing bodies 100-101, 107-112, 119
Human rights
HR2 Selection of suppliers and subcontractors according to the impact on human rights 59
HR3 Employee training on policies and procedures relating to human rights 103
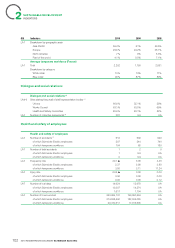
Society
SO1 Impact on community 80-87
SO3employees trained in anti-corruption policies and procedures 50
SO4 Actions taken to contend with corruption cases 48-49, 50, 60
SO7 Legal actions for anti-competitive behavior 42
SO8 Monetary of value of signifi cant fi nes 42
Product responsibility
PR1 Life cycle stages in which health and safety impacts of products are assessed for improvements 62, 66-68
PR2 Non-compliance incidents concerning health and safety impacts of products and services,
byresult type
39
PR3 Information on products and labeling 66-68
PR4 Non-compliance incidents concerning information on products and services and their labeling,
byresult type
39
PR5 Customer satisfaction 26, 37-38
2010 REGISTRATION DOCUMENT SCHNEIDER ELECTRIC 93
2