APC 2010 Annual Report Download - page 147
Download and view the complete annual report
Please find page 147 of the 2010 APC annual report below. You can navigate through the pages in the report by either clicking on the pages listed below, or by using the keyword search tool below to find specific information within the annual report.-
 1
1 -
2
-
3
-
4
-
5
-
6
-
7
-
8
-
9
-
10
-
11
-
12
-
13
-
14
-
15
-
16
-
17
-
18
-
19
-
20
-
21
-
22
-
23
-
24
-
25
-
26
-
27
-
28
-
29
-
30
-
31
-
32
-
33
-
34
-
35
-
36
-
37
-
38
-
39
-
40
-
41
-
42
-
43
-
44
-
45
-
46
-
47
-
48
-
49
-
50
-
51
-
52
-
53
-
54
-
55
-
56
-
57
-
58
-
59
-
60
-
61
-
62
-
63
-
64
-
65
-
66
-
67
-
68
-
69
-
70
-
71
-
72
-
73
-
74
-
75
-
76
-
77
-
78
-
79
-
80
-
81
-
82
-
83
-
84
-
85
-
86
-
87
-
88
-
89
-
90
-
91
-
92
-
93
-
94
-
95
-
96
-
97
-
98
-
99
-
100
-
101
-
102
-
103
-
104
-
105
-
106
-
107
-
108
-
109
-
110
-
111
-
112
-
113
-
114
-
115
-
116
-
117
-
118
-
119
-
120
-
121
-
122
-
123
-
124
-
125
-
126
-
127
-
128
-
129
-
130
-
131
-
132
-
133
-
134
-
135
-
136
-
 137
137 -
 138
138 -
 139
139 -
 140
140 -
 141
141 -
 142
142 -
 143
143 -
 144
144 -
 145
145 -
 146
146 -
 147
147 -
 148
148 -
 149
149 -
 150
150 -
 151
151 -
 152
152 -
 153
153 -
 154
154 -
 155
155 -
 156
156 -
 157
157 -
158
-
159
-
160
-
161
-
162
-
163
-
164
-
165
-
166
-
167
-
168
-
169
-
170
-
171
-
172
-
173
-
174
-
175
-
176
-
177
-
178
-
179
-
180
-
181
-
182
-
183
-
184
-
185
-
186
-
187
-
188
-
189
-
190
-
191
-
192
-
193
-
194
-
195
-
196
-
197
-
198
-
199
-
200
-
201
-
202
-
203
-
204
-
205
-
206
-
207
-
208
-
209
-
210
-
211
-
212
-
213
-
214
-
215
-
216
-
217
-
218
-
219
-
220
-
221
-
222
-
223
-
224
-
225
-
226
-
227
-
228
-
229
-
230
-
231
-
232
-
233
-
234
-
235
-
236
-
237
-
238
-
239
-
240
-
241
-
242
-
243
-
244
-
245
-
246
-
247
-
248
-
249
-
250
-
251
-
252
-
253
-
254
-
255
-
256
-
257
-
258
-
259
-
260
-
261
-
262
-
263
-
264
-
265
-
266
-
267
-
268
-
269
-
270
-
271
-
272
-
273
-
274
-
275
-
276
-
277
-
278
-
279
-
280
-
281
-
282
-
283
-
284
-
285
-
286
-
287
-
288
-
289
-
290
-
291
-
292
 |
 |

BUSINESS REVIEW
4
REVIEW OF THE CONSOLIDATED FINANCIAL STATEMENTS
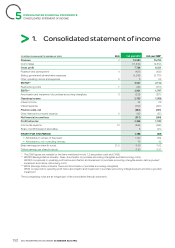
Profit for the period
Net income for the period attributable to the equity holders of the
parent company amounted to EUR1,720 million, a steep increase
over 2009 (EUR824 million).
Earnings per share
Earnings per share amounted to EUR6.59 in 2010 compared with
EUR3.32 in 2009.
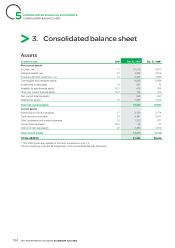
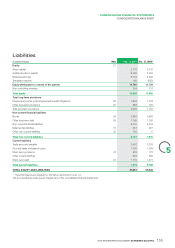
Review of balance sheet and cash flow statement items
Total consolidated balance sheet amounted to EUR31,051 million
as at December31, 2010, up 21% compared with December31,
2009. Non-current assets amounted to EUR18,832 million or 61%
of total assets.
Goodwill
Goodwill amounted to EUR10,213 million or 33% of total assets, up
by EUR1,602 million compared with December31, 2009.
The Group’s acquisitions – mainly comprising Areva Distribution – in
2010 accounted for EUR938 million of the increase. Changes in
foreign exchange rates accounted for EUR675 million of the increase.
EUR15 million of impairment losses have been recognised against
two small businesses in the process of sale. The Group’s impairment
tests did not lead to the recognition of any additional impairment
losses during the period.
Property, plant and equipment and intangible
assets
Property, plant and equipment and intangible assets amounted to
EUR6,595 million or 21% of total assets, up 12% compared with
December31, 2009.
Intangible assets
Trademarks amounted to EUR2,426 million at December31, 2010,
an increase of EUR138 million compared with December31, 2009
mainly as a result of foreign exchange differences.
Gross capitalised development costs totaled EUR1,085 million
(EUR718 million net), including the capitalisation of costs for current
projects in an amount of EUR197 million.
Other intangible assets, net, consisting primarily of customer lists
recognised on acquisition, software and patents, increased by
EUR110 million over the year primarily due to the EUR164 million
of intangible assets recognised in the balance sheet following the
acquisition of Areva Distribution.
Property, plant and equipment
Net property, plant and equipment came to EUR2,337 million, an
increase of EUR372 million compared with December31, 2009.
Investments in associates
Investments in associates amounted to EUR447 million, a steep
rise compared to the balance of EUR75 million as at December31,
2009. The increase refl ects:
•the acquisition of the 50% interest in Electroshield-TM Samara
Group, in Russia, recognised for EUR266 million at the year-end,
•Areva Distribution’s investment in Sunten Electric Equipment, in
China, valued at EUR85 million at the year-end.
Non-current financial assets
Non-current fi nancial assets totaled EUR554 million compared with
EUR347million as at December31, 2009. They mainly comprised
listed equity investments (Axa shares) for EUR132 million and shares
from acquired companies at the end of the year and that will be
consolidated at the begining of 2011, for EUR 184 million.
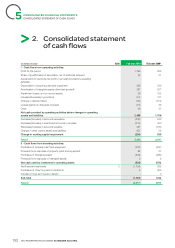
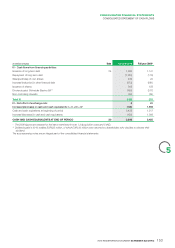
Cash and net debt
Net cash provided by operating activities before changes in operating
assets and liabilities came to EUR2,468 million versus EUR1,708
million in 2009, and represented 12.6% of revenue compared with
10.8% the year before.
Change in working capital requirement consumed EUR206 million in
cash, refl ecting the large increase in trade receivables and inventories
generated by the corresponding rise in revenue.
In all, net cash provided by operating activities totalled EUR2,262
million in 2010 compared with EUR2,547 million in 2009.
Net capital expenditure, which includes capitalised development
projects, represented an outlay of EUR528 million, or 2.7% of
revenue, compared with EUR576 million, or 3.6% in 2009.
The year’s acquisitions, negligible in 2009, represented a cash
outfl ow of EUR1,754 million in 2010 net of cash acquired; the main
acquisition of the period was Areva Distribution for EUR1,138 million.
The sale of treasury stock generated a net cash infl ow of EUR249
million (EUR22 million in 2009), mainly relating to the sale of the
Schneider Electric SA shares previously held by the Group’s Cofi bel
and Cofi mines subsidiaries. Dividends paid totaled EUR245 million,
of which EUR46 million to minority interests, less than the EUR351
million paid in 2009, of which EUR34 million to minority interests, as
a result of a reduction in the dividend per share.
2010 REGISTRATION DOCUMENT SCHNEIDER ELECTRIC 145