APC 2010 Annual Report Download - page 196
Download and view the complete annual report
Please find page 196 of the 2010 APC annual report below. You can navigate through the pages in the report by either clicking on the pages listed below, or by using the keyword search tool below to find specific information within the annual report.-
 1
1 -
2
-
3
-
4
-
5
-
6
-
7
-
8
-
9
-
10
-
11
-
12
-
13
-
14
-
15
-
16
-
17
-
18
-
19
-
20
-
21
-
22
-
23
-
24
-
25
-
26
-
27
-
28
-
29
-
30
-
31
-
32
-
33
-
34
-
35
-
36
-
37
-
38
-
39
-
40
-
41
-
42
-
43
-
44
-
45
-
46
-
47
-
48
-
49
-
50
-
51
-
52
-
53
-
54
-
55
-
56
-
57
-
58
-
59
-
60
-
61
-
62
-
63
-
64
-
65
-
66
-
67
-
68
-
69
-
70
-
71
-
72
-
73
-
74
-
75
-
76
-
77
-
78
-
79
-
80
-
81
-
82
-
83
-
84
-
85
-
86
-
87
-
88
-
89
-
90
-
91
-
92
-
93
-
94
-
95
-
96
-
97
-
98
-
99
-
100
-
101
-
102
-
103
-
104
-
105
-
106
-
107
-
108
-
109
-
110
-
111
-
112
-
113
-
114
-
115
-
116
-
117
-
118
-
119
-
120
-
121
-
122
-
123
-
124
-
125
-
126
-
127
-
128
-
129
-
130
-
131
-
132
-
133
-
134
-
135
-
136
-
137
-
138
-
139
-
140
-
141
-
142
-
143
-
144
-
145
-
146
-
147
-
148
-
149
-
150
-
151
-
152
-
153
-
154
-
155
-
156
-
157
-
158
-
159
-
160
-
161
-
162
-
163
-
164
-
165
-
166
-
167
-
168
-
169
-
170
-
171
-
172
-
173
-
174
-
175
-
176
-
177
-
178
-
179
-
180
-
181
-
182
-
183
-
184
-
185
-
 186
186 -
 187
187 -
 188
188 -
 189
189 -
 190
190 -
 191
191 -
 192
192 -
 193
193 -
 194
194 -
 195
195 -
 196
196 -
 197
197 -
 198
198 -
 199
199 -
 200
200 -
 201
201 -
 202
202 -
 203
203 -
 204
204 -
 205
205 -
 206
206 -
207
-
208
-
209
-
210
-
211
-
212
-
213
-
214
-
215
-
216
-
217
-
218
-
219
-
220
-
221
-
222
-
223
-
224
-
225
-
226
-
227
-
228
-
229
-
230
-
231
-
232
-
233
-
234
-
235
-
236
-
237
-
238
-
239
-
240
-
241
-
242
-
243
-
244
-
245
-
246
-
247
-
248
-
249
-
250
-
251
-
252
-
253
-
254
-
255
-
256
-
257
-
258
-
259
-
260
-
261
-
262
-
263
-
264
-
265
-
266
-
267
-
268
-
269
-
270
-
271
-
272
-
273
-
274
-
275
-
276
-
277
-
278
-
279
-
280
-
281
-
282
-
283
-
284
-
285
-
286
-
287
-
288
-
289
-
290
-
291
-
292
 |
 |

CONSOLIDATED FINANCIAL STATEMENTS
5NOTES TO THE CONSOLIDATED FINANCIAL STATEMENTS
Dec.31, 2010 Dec.31, 2009
Of which SE
USA
Of which SE
USA
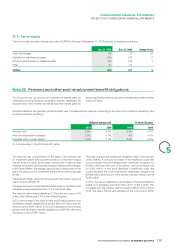
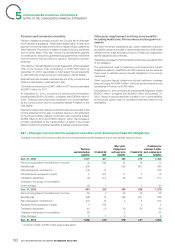
3. Change in projected benefi t obligation
Projected benefi t obligation at beginning of year 2,055 937 2,036 1,013
Service cost 43 255 18
Interest cost (effect of discounting) 109 56 109 57
Plan participants’ contributions 4 -3-
Benefi ts paid (134) (48) (132) (43)
Actuarial (gains)/losses recognised in equity 42 14 75 16
Past service cost 5 -1-
Changes in the scope of consolidation 87 ---
Translation adjustments 130 73 1(33)
Curtailments and settlements (7) -(92) (92)
Other 6 -(1) 1
PROJECTED BENEFIT OBLIGATION
AT END OF YEAR 2,340
1,034
2,055
937
Actuarial gains and losses have been fully recognised in Other
reserves.
They stem mainly from changes in actuarial assumptions (primarily
discount rates) used to measure obligations in the United States, the
United Kingdom and the euro zone.
At December31, 2010, actuarial gains relative to the effects of
experience on pension and termination benefi t obligations totaled
EUR49million for the Group.
At December31, 2009, actuarial gains relative to the effects of
experience totaled EUR64million for the Group. At December31,
2008, actuarial losses relative to the effects of experience totaled
EUR445million. At December31, 2007, actuarial losses relative to
the effects of experience totaled EUR2million.
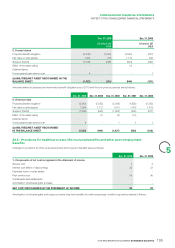
Dec.31, 2010 Dec.31, 2009
Of which SE
USA
Of which SE
USA
4. Change in fair value of plan assets
Fair value of plan assets at beginning of year 1,112 643 1,010 611
Expected return on plan assets 82 56 74 50
Plan participants’ contribution 4 -4-
Employer contributions 21 118 1
Benefi ts paid (76) (47) (68) (43)
Actuarial gains/(losses) recognised in equity 38 32 71 47
Changes in the scope of consolidation 29 ---
Translation adjustments 90 50 3(22)
Curtailments and settlements - ---
Other 4 --(1)
FAIR VALUE OF PLAN ASSETS AT END OF YEAR 1,304
735
1,112
643
The actual return on plan assets was EUR120million.
Actuarial gains and losses have been fully recognised in Other reserves.
They stem mainly from the differential between the effective and expected return on plan assets in the US, UK and Canada.
2010 REGISTRATION DOCUMENT SCHNEIDER ELECTRIC194