APC 2010 Annual Report Download - page 189
Download and view the complete annual report
Please find page 189 of the 2010 APC annual report below. You can navigate through the pages in the report by either clicking on the pages listed below, or by using the keyword search tool below to find specific information within the annual report.-
 1
1 -
2
-
3
-
4
-
5
-
6
-
7
-
8
-
9
-
10
-
11
-
12
-
13
-
14
-
15
-
16
-
17
-
18
-
19
-
20
-
21
-
22
-
23
-
24
-
25
-
26
-
27
-
28
-
29
-
30
-
31
-
32
-
33
-
34
-
35
-
36
-
37
-
38
-
39
-
40
-
41
-
42
-
43
-
44
-
45
-
46
-
47
-
48
-
49
-
50
-
51
-
52
-
53
-
54
-
55
-
56
-
57
-
58
-
59
-
60
-
61
-
62
-
63
-
64
-
65
-
66
-
67
-
68
-
69
-
70
-
71
-
72
-
73
-
74
-
75
-
76
-
77
-
78
-
79
-
80
-
81
-
82
-
83
-
84
-
85
-
86
-
87
-
88
-
89
-
90
-
91
-
92
-
93
-
94
-
95
-
96
-
97
-
98
-
99
-
100
-
101
-
102
-
103
-
104
-
105
-
106
-
107
-
108
-
109
-
110
-
111
-
112
-
113
-
114
-
115
-
116
-
117
-
118
-
119
-
120
-
121
-
122
-
123
-
124
-
125
-
126
-
127
-
128
-
129
-
130
-
131
-
132
-
133
-
134
-
135
-
136
-
137
-
138
-
139
-
140
-
141
-
142
-
143
-
144
-
145
-
146
-
147
-
148
-
149
-
150
-
151
-
152
-
153
-
154
-
155
-
156
-
157
-
158
-
159
-
160
-
161
-
162
-
163
-
164
-
165
-
166
-
167
-
168
-
169
-
170
-
171
-
172
-
173
-
174
-
175
-
176
-
177
-
178
-
 179
179 -
 180
180 -
 181
181 -
 182
182 -
 183
183 -
 184
184 -
 185
185 -
 186
186 -
 187
187 -
 188
188 -
 189
189 -
 190
190 -
 191
191 -
 192
192 -
 193
193 -
 194
194 -
 195
195 -
 196
196 -
 197
197 -
 198
198 -
 199
199 -
200
-
201
-
202
-
203
-
204
-
205
-
206
-
207
-
208
-
209
-
210
-
211
-
212
-
213
-
214
-
215
-
216
-
217
-
218
-
219
-
220
-
221
-
222
-
223
-
224
-
225
-
226
-
227
-
228
-
229
-
230
-
231
-
232
-
233
-
234
-
235
-
236
-
237
-
238
-
239
-
240
-
241
-
242
-
243
-
244
-
245
-
246
-
247
-
248
-
249
-
250
-
251
-
252
-
253
-
254
-
255
-
256
-
257
-
258
-
259
-
260
-
261
-
262
-
263
-
264
-
265
-
266
-
267
-
268
-
269
-
270
-
271
-
272
-
273
-
274
-
275
-
276
-
277
-
278
-
279
-
280
-
281
-
282
-
283
-
284
-
285
-
286
-
287
-
288
-
289
-
290
-
291
-
292
 |
 |

CONSOLIDATED FINANCIAL STATEMENTS
5
NOTES TO THE CONSOLIDATED FINANCIAL STATEMENTS
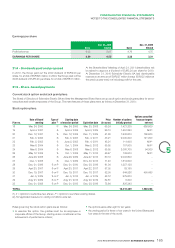
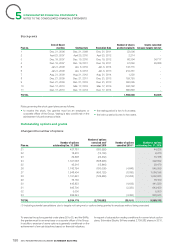
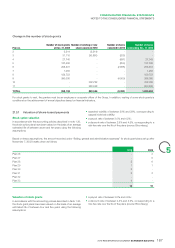
Change in the number of stock grants
Plan no. Number of stock grants
atDec.31, 2009 Number of existing or new
shares grants in 2010 Number of shares
cancelled in 2010 Number of shares
outstanding Dec.31, 2010
22,214 (2,214) - -
331,115 (30,860) (255) -
427,740 - (697) 27,043
5 137,590 - (250) 137,340
6208,401 - (2,888) 205,513
71,250 - - 1,250
8 159,753 - - 159,753
9390,095 - (4,000) 386,095
10 - 332,762 - 332,762
11 - 580,848 - 580,848
TOTAL 958,158 880,536 (8,090) 1,830,604
For stock grants to vest, the grantee must be an employee or corporate offi cer of the Group. In addition, vesting of some stock grants is
conditional on the achievement of annual objectives based on fi nancial indicators.
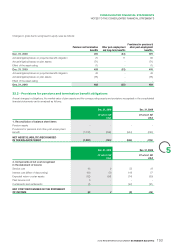
21.5.1 Valuation of share-based payments
Stock option valuation
In accordance with the accounting policies described in note1.20,
the stock option plans have been valued on the basis of an average
estimated life of between seven and ten years using the following
assumptions:
•expected volatility of between 20% and 28%, corresponding to
capped historical volatility;
•a payout rate of between 3.0% and 4.5%;
•a discount rate of between 2.9% and 4.5%, corresponding to a
risk-free rate over the life of the plans (source: Bloomberg).
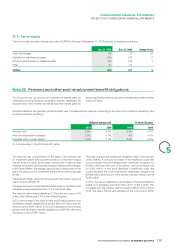
Based on these assumptions, the amount recorded under “Selling, general and administrative expenses” for stock grant plans set up after
November7, 2002 breaks down as follows:
2010 2009
Plan 26 -2
Plan 27 -5
Plan 28 56
Plan 29 11
Plan 30 2-
Plan 31 22
Plan 32 --
Plan 33 4-
14 16
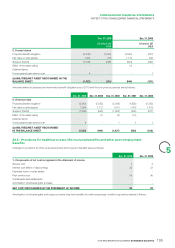
Valuation of stock grants
In accordance with the accounting policies described in Note1.20,
the stock grant plans have been valued on the basis of an average
estimated life of between four and fi ve years using the following
assumptions:
•a payout rate of between 3.0% and 4.5%;
•a discount rate of between 2.4% and 4.5%, corresponding to a
risk-free rate over the life of the plans (source: Bloomberg).
2010 REGISTRATION DOCUMENT SCHNEIDER ELECTRIC 187