APC 2010 Annual Report Download - page 233
Download and view the complete annual report
Please find page 233 of the 2010 APC annual report below. You can navigate through the pages in the report by either clicking on the pages listed below, or by using the keyword search tool below to find specific information within the annual report.-
 1
1 -
2
-
3
-
4
-
5
-
6
-
7
-
8
-
9
-
10
-
11
-
12
-
13
-
14
-
15
-
16
-
17
-
18
-
19
-
20
-
21
-
22
-
23
-
24
-
25
-
26
-
27
-
28
-
29
-
30
-
31
-
32
-
33
-
34
-
35
-
36
-
37
-
38
-
39
-
40
-
41
-
42
-
43
-
44
-
45
-
46
-
47
-
48
-
49
-
50
-
51
-
52
-
53
-
54
-
55
-
56
-
57
-
58
-
59
-
60
-
61
-
62
-
63
-
64
-
65
-
66
-
67
-
68
-
69
-
70
-
71
-
72
-
73
-
74
-
75
-
76
-
77
-
78
-
79
-
80
-
81
-
82
-
83
-
84
-
85
-
86
-
87
-
88
-
89
-
90
-
91
-
92
-
93
-
94
-
95
-
96
-
97
-
98
-
99
-
100
-
101
-
102
-
103
-
104
-
105
-
106
-
107
-
108
-
109
-
110
-
111
-
112
-
113
-
114
-
115
-
116
-
117
-
118
-
119
-
120
-
121
-
122
-
123
-
124
-
125
-
126
-
127
-
128
-
129
-
130
-
131
-
132
-
133
-
134
-
135
-
136
-
137
-
138
-
139
-
140
-
141
-
142
-
143
-
144
-
145
-
146
-
147
-
148
-
149
-
150
-
151
-
152
-
153
-
154
-
155
-
156
-
157
-
158
-
159
-
160
-
161
-
162
-
163
-
164
-
165
-
166
-
167
-
168
-
169
-
170
-
171
-
172
-
173
-
174
-
175
-
176
-
177
-
178
-
179
-
180
-
181
-
182
-
183
-
184
-
185
-
186
-
187
-
188
-
189
-
190
-
191
-
192
-
193
-
194
-
195
-
196
-
197
-
198
-
199
-
200
-
201
-
202
-
203
-
204
-
205
-
206
-
207
-
208
-
209
-
210
-
211
-
212
-
213
-
214
-
215
-
216
-
217
-
218
-
219
-
220
-
221
-
222
-
 223
223 -
 224
224 -
 225
225 -
 226
226 -
 227
227 -
 228
228 -
 229
229 -
 230
230 -
 231
231 -
 232
232 -
 233
233 -
 234
234 -
 235
235 -
 236
236 -
 237
237 -
 238
238 -
 239
239 -
 240
240 -
 241
241 -
 242
242 -
 243
243 -
244
-
245
-
246
-
247
-
248
-
249
-
250
-
251
-
252
-
253
-
254
-
255
-
256
-
257
-
258
-
259
-
260
-
261
-
262
-
263
-
264
-
265
-
266
-
267
-
268
-
269
-
270
-
271
-
272
-
273
-
274
-
275
-
276
-
277
-
278
-
279
-
280
-
281
-
282
-
283
-
284
-
285
-
286
-
287
-
288
-
289
-
290
-
291
-
292
 |
 |

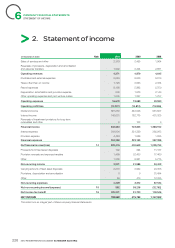
COMPANY FINANCIAL STATEMENTS
NOTES TO THE FINANCIAL STATEMENTS
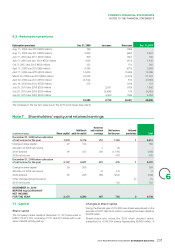
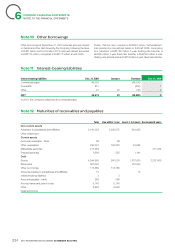
6.3 - Redemption premiums
Redemption premiums Dec. 31, 2009 Increases Decreases Dec. 31, 2010
Aug. 11, 2005 due 2010 (€900 million) 199 (199) -
Aug. 11, 2005 due 2017 (€600 million) 3,208 (367) 2,841
July 17, 2006 due 2011 (€500 million) 306 (197) 109
July 17, 2006 due Jan. 2014 (€500 million) 1,856 (413) 1,443
Oct. 8, 2007 due 2015 (€600 million) 353 (71) 283
April 11, 2008 due 2018 (€55 million) 6,256 (672) 5,584
April 11, 2008 due 2018 (€125 million) 14,605 (1,566) 13,039
March 20, 2009 due 2018 (€250 million) 30,275 (3,234) 27,041
April 30, 2009 due 2014 (€150 million) (3,734) 674 (3,060)
Jan. 16, 2009 due 2013 (€750 million) 270 (139) 131
July 20, 2010 due 2016 (€300 million) 2,031 (139) 1,892
July 20, 2010 due 2016 (€200 million) (3,698) 138 (3,560)
July 20, 2010 due 2020 (€500 million) 4,400 (146) 4,254
53,593 2,733 (6,331) 49,995
The increases in this line item were due to the 2010 bond issues (see note9).
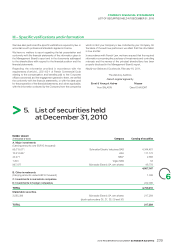
Note7
Shareholders’ equity and retained earnings
(in millions of euros) Share capital Additional
paid-in capital
Reserves
and retained
earnings Net income
for the year Untaxed
provisions Total
December 31, 2008 before allocation
of net income for the year 1,979 5,276 210 1,148 1 8,614
Change in share capital 27 132 159
Allocation of 2008 net income 2 (2) -
2008 dividend 96 423 309 (1,146) (318)
2009 net income 476 476
December 31, 2009 before allocation
of net income for the year 2,102 5,831 521 476 1 8,931
Change in share capital 39 265 304
Allocation of 2009 net income 12 (12) 0
2009 dividend 35 296 (66) (464) (199)
Other changes during the period (1) (1)
2010 net income 703 703
DECEMBER 31, 2010
BEFOREALLOCATION OF
NETINCOME
FOR THE YEAR 2,175 6,393 467 703 0 9,738
7.1 - Capital
Share capital
The Company’s share capital at December31, 2010 amounted to
EUR2,175,672,728, consisting of 271,959,091shares with a par
value of EUR8, all fully paid up.
Changes in share capital
During the fi nancial year, 2,709,882 new shares were issued on the
exercise of 9,207,066 stock options, increasing the share capital by
EUR74million.
Shareholders who chose the 2009 stock dividend option
subscribed for 4,345,794 shares representing EUR35million. A
2010 REGISTRATION DOCUMENT SCHNEIDER ELECTRIC 231
6