APC 2010 Annual Report Download - page 171
Download and view the complete annual report
Please find page 171 of the 2010 APC annual report below. You can navigate through the pages in the report by either clicking on the pages listed below, or by using the keyword search tool below to find specific information within the annual report.-
 1
1 -
2
-
3
-
4
-
5
-
6
-
7
-
8
-
9
-
10
-
11
-
12
-
13
-
14
-
15
-
16
-
17
-
18
-
19
-
20
-
21
-
22
-
23
-
24
-
25
-
26
-
27
-
28
-
29
-
30
-
31
-
32
-
33
-
34
-
35
-
36
-
37
-
38
-
39
-
40
-
41
-
42
-
43
-
44
-
45
-
46
-
47
-
48
-
49
-
50
-
51
-
52
-
53
-
54
-
55
-
56
-
57
-
58
-
59
-
60
-
61
-
62
-
63
-
64
-
65
-
66
-
67
-
68
-
69
-
70
-
71
-
72
-
73
-
74
-
75
-
76
-
77
-
78
-
79
-
80
-
81
-
82
-
83
-
84
-
85
-
86
-
87
-
88
-
89
-
90
-
91
-
92
-
93
-
94
-
95
-
96
-
97
-
98
-
99
-
100
-
101
-
102
-
103
-
104
-
105
-
106
-
107
-
108
-
109
-
110
-
111
-
112
-
113
-
114
-
115
-
116
-
117
-
118
-
119
-
120
-
121
-
122
-
123
-
124
-
125
-
126
-
127
-
128
-
129
-
130
-
131
-
132
-
133
-
134
-
135
-
136
-
137
-
138
-
139
-
140
-
141
-
142
-
143
-
144
-
145
-
146
-
147
-
148
-
149
-
150
-
151
-
152
-
153
-
154
-
155
-
156
-
157
-
158
-
159
-
160
-
 161
161 -
 162
162 -
 163
163 -
 164
164 -
 165
165 -
 166
166 -
 167
167 -
 168
168 -
 169
169 -
 170
170 -
 171
171 -
 172
172 -
 173
173 -
 174
174 -
 175
175 -
 176
176 -
 177
177 -
 178
178 -
 179
179 -
 180
180 -
 181
181 -
182
-
183
-
184
-
185
-
186
-
187
-
188
-
189
-
190
-
191
-
192
-
193
-
194
-
195
-
196
-
197
-
198
-
199
-
200
-
201
-
202
-
203
-
204
-
205
-
206
-
207
-
208
-
209
-
210
-
211
-
212
-
213
-
214
-
215
-
216
-
217
-
218
-
219
-
220
-
221
-
222
-
223
-
224
-
225
-
226
-
227
-
228
-
229
-
230
-
231
-
232
-
233
-
234
-
235
-
236
-
237
-
238
-
239
-
240
-
241
-
242
-
243
-
244
-
245
-
246
-
247
-
248
-
249
-
250
-
251
-
252
-
253
-
254
-
255
-
256
-
257
-
258
-
259
-
260
-
261
-
262
-
263
-
264
-
265
-
266
-
267
-
268
-
269
-
270
-
271
-
272
-
273
-
274
-
275
-
276
-
277
-
278
-
279
-
280
-
281
-
282
-
283
-
284
-
285
-
286
-
287
-
288
-
289
-
290
-
291
-
292
 |
 |

CONSOLIDATED FINANCIAL STATEMENTS
5
NOTES TO THE CONSOLIDATED FINANCIAL STATEMENTS
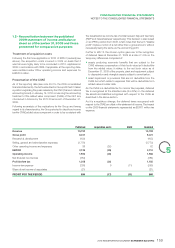
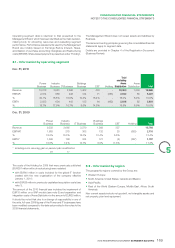
Operating segment data is identical to that presented to the
Management Board, which has been identifi ed as the main decision-
making body for allocating resources and evaluating segment
performance. Performance assessments used by the Management
Board are notably based on Earnings Before Interest, Taxes,
amortisation of purchase accounting intangibles and Restructuring
costs (EBITAR). Share-based payment is presented under “Holding”.
The Management Board does not review assets and liabilities by
Business.
The same accounting principles governing the consolidated fi nancial
statements apply to segment data.
Details are provided in Chapter4 of the Registration Document
(Business Review).
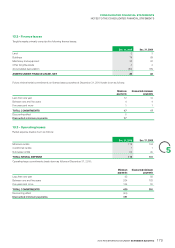
3.1 - Information by operating segment
Dec. 31, 2010
Power
Business
Industry
Business IT Business
Buildings
Business CST Holding
Total
excluding
Areva
Distribution
Areva
Distribution Total
Revenue 10,318 3,551 2,646 1,402 433 - 18,350 1,230 19,580
EBITAR 2,074 668 448 144 71 (463) 2,942 85 3,027
% 20.1% 18.8% 16.9% 10.3% 16.4% - 16.0% 6.9% 15.5%
EBITA 2,032 634 443 135 64 (462) 2,846 85 2,931
% 19.7% 17.9% 16.7% 9.6% 14.8% - 15.5% 6.9% 15.0%
Dec. 31, 2009
Power
Business
Industry
Business IT Business
Buildings
Business CST Holding Total
Revenue 9,233 2,665 2,270 1,268 357 - 15,793
EBITAR* 1,683 275 363 132 20 (363) 2,110
% 18.2% 10.3% 16.0% 10.4% 5.6% - 13.4%
EBITA* 1,535 198 334 121 (4) (387) 1,797
% 16.6% 7.4% 14.7% 9.5% (1.1)% - 11.4%
*
Including a non recurring gain on pension plan modifi cation:
81 11
The costs of the Holding for 2009 that were previously published
(EUR297million without restructuring) were restated:
•with EUR40million in costs included for the global IT function
created with the new organisation of the company effective
January1, 2010;
•with EUR26million in previously-capitalised acquisition costs (see
note1).
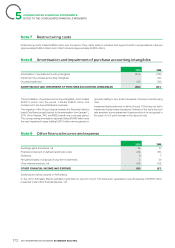
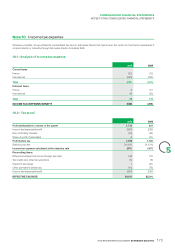
The amount of the 2010 fi nancial year includes the impairment of
EUR15million on a SAP module (see note5) and separation and
integration costs of Areva Distribution in the amount of EUR25million.
It should be noted that due to a change of responsibility in one of
the units, full-year2009 fi gures of the Power and IT businesses have
been modifi ed compared to the data set provided in the notes to the
2009 fi nancial statements.
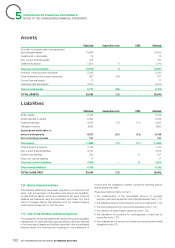
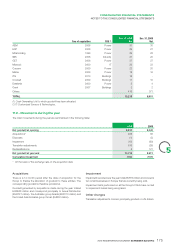
3.2 - Information by region
The geographic regions covered by the Group are:
•Western Europe;
•North America: United States, Canada and Mexico;
•Asia-Pacifi c;
•Rest of the World (Eastern Europe, Middle East, Africa, South
America).
Non-current assets include net goodwill, net intangible assets and
net property, plant and equipment.
2010 REGISTRATION DOCUMENT SCHNEIDER ELECTRIC 169