APC 2010 Annual Report Download - page 142
Download and view the complete annual report
Please find page 142 of the 2010 APC annual report below. You can navigate through the pages in the report by either clicking on the pages listed below, or by using the keyword search tool below to find specific information within the annual report.-
 1
1 -
2
-
3
-
4
-
5
-
6
-
7
-
8
-
9
-
10
-
11
-
12
-
13
-
14
-
15
-
16
-
17
-
18
-
19
-
20
-
21
-
22
-
23
-
24
-
25
-
26
-
27
-
28
-
29
-
30
-
31
-
32
-
33
-
34
-
35
-
36
-
37
-
38
-
39
-
40
-
41
-
42
-
43
-
44
-
45
-
46
-
47
-
48
-
49
-
50
-
51
-
52
-
53
-
54
-
55
-
56
-
57
-
58
-
59
-
60
-
61
-
62
-
63
-
64
-
65
-
66
-
67
-
68
-
69
-
70
-
71
-
72
-
73
-
74
-
75
-
76
-
77
-
78
-
79
-
80
-
81
-
82
-
83
-
84
-
85
-
86
-
87
-
88
-
89
-
90
-
91
-
92
-
93
-
94
-
95
-
96
-
97
-
98
-
99
-
100
-
101
-
102
-
103
-
104
-
105
-
106
-
107
-
108
-
109
-
110
-
111
-
112
-
113
-
114
-
115
-
116
-
117
-
118
-
119
-
120
-
121
-
122
-
123
-
124
-
125
-
126
-
127
-
128
-
129
-
130
-
131
-
 132
132 -
 133
133 -
 134
134 -
 135
135 -
 136
136 -
 137
137 -
 138
138 -
 139
139 -
 140
140 -
 141
141 -
 142
142 -
 143
143 -
 144
144 -
 145
145 -
 146
146 -
 147
147 -
 148
148 -
 149
149 -
 150
150 -
 151
151 -
 152
152 -
153
-
154
-
155
-
156
-
157
-
158
-
159
-
160
-
161
-
162
-
163
-
164
-
165
-
166
-
167
-
168
-
169
-
170
-
171
-
172
-
173
-
174
-
175
-
176
-
177
-
178
-
179
-
180
-
181
-
182
-
183
-
184
-
185
-
186
-
187
-
188
-
189
-
190
-
191
-
192
-
193
-
194
-
195
-
196
-
197
-
198
-
199
-
200
-
201
-
202
-
203
-
204
-
205
-
206
-
207
-
208
-
209
-
210
-
211
-
212
-
213
-
214
-
215
-
216
-
217
-
218
-
219
-
220
-
221
-
222
-
223
-
224
-
225
-
226
-
227
-
228
-
229
-
230
-
231
-
232
-
233
-
234
-
235
-
236
-
237
-
238
-
239
-
240
-
241
-
242
-
243
-
244
-
245
-
246
-
247
-
248
-
249
-
250
-
251
-
252
-
253
-
254
-
255
-
256
-
257
-
258
-
259
-
260
-
261
-
262
-
263
-
264
-
265
-
266
-
267
-
268
-
269
-
270
-
271
-
272
-
273
-
274
-
275
-
276
-
277
-
278
-
279
-
280
-
281
-
282
-
283
-
284
-
285
-
286
-
287
-
288
-
289
-
290
-
291
-
292
 |
 |

BUSINESS REVIEW
4TRENDS IN SCHNEIDER ELECTRIC’S CORE MARKETS
>
1. Trends in Schneider Electric’s core
markets
Industries and Machine manufacturers
After the sharp contraction experienced between October2008 and
April2009 after Lehman Brothers fi led for bankruptcy, provoking
a brutal stop to industrial investment in all sectors, the industry
market and Machine Manufacturers rebounded as sharply in all our
geographic zones.
The rebound began at the end of the second quarter of 2009
and continued and even accelerated in 2010. A mild increase in
our clients’ inventories amplifi ed this growth during the fi rst half of
the year but had no major impact on the year as a whole given a
renewed fall in inventories during the fourth quarter.
The upturn in the market had the greatest impact on OEMs (original
equipments manufacturers) with strong but erratic growth for both
low-end and high-end solutions. This pattern of recession followed
by growth exerted strong pressure on our vendors, particularly of
electronic components, with an increase of lead times during the
fi rst half of the year that had practically been absorbed by the end
of the year.
The emerging markets have already grown beyond their level of
before the crisis, notably throughout Asia and Latin America, in
contrast with Europe, North America and Japan whose exports to
the emerging countries have boomed but whose domestic markets
have remained sluggish.
In the water and mining, metals and minerals segments new
investment materialised more slowly, with few new projects launched
given the still-fragile context for fi nancing them, but also with a strong
upturn in the volume of requests for tender during the second half of
the year which augurs well for growth in 2011.
Despite the restriction on new spending, notably in Africa and the
Middle East, environmental constraints were a factor of resilience
given the stimulus both to measure and report energy consumption
and achieve actual reductions in consumption. In response to
government policies, industrialists now seek to improve effi ciency
throughout the production cycle.
For example in the water segment, infrastructure needs helped prop
up demand across the water cycle, from supply and desalination
to distribution and wastewater treatment. Programs are being
developed to optimise and reduce the energy consumption of
these activities. These programs are driven by government policies
and, most important, the obligation to control water prices. Water
operators also increasingly aim to improve the management of their
grids in terms both of security and reduction of waste.
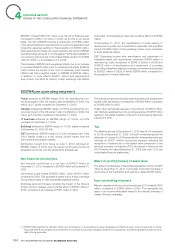
Non residential buildings
Over 2010 as a whole, the Non-residential buildings market declined
again both in the United States and in Western and Central Europe.
In the mature countries, offi ces, stores and industrial buildings, which
depend on corporate investment, saw the sharpest declines, while
administrative buildings, hospitals and schools held up better.
Building permits and starts showed signs of improvement in the
mature countries.
Market growth was stronger in the emerging Asian countries and
South America and increased slightly in Africa and the Middle East.
Residential
After two years of sharp contraction, the Residential market improved
worldwide in 2010 before stabilising during the course of the year
in Europe and the United States. In Europe, only the “peripheral”
countries (Spain, Portugal, Greece and Ireland) continued to pursue
steep decline.
In the Asia-Pacifi c region the market, which only slowed during the
global recession, managed two-digit growth in 2010. As for the new
EMEAS economies, they remained in recession in Europe, stabilised
in Russia and rose sharply in South America.
2010 REGISTRATION DOCUMENT SCHNEIDER ELECTRIC140