APC 2010 Annual Report Download - page 187
Download and view the complete annual report
Please find page 187 of the 2010 APC annual report below. You can navigate through the pages in the report by either clicking on the pages listed below, or by using the keyword search tool below to find specific information within the annual report.-
 1
1 -
2
-
3
-
4
-
5
-
6
-
7
-
8
-
9
-
10
-
11
-
12
-
13
-
14
-
15
-
16
-
17
-
18
-
19
-
20
-
21
-
22
-
23
-
24
-
25
-
26
-
27
-
28
-
29
-
30
-
31
-
32
-
33
-
34
-
35
-
36
-
37
-
38
-
39
-
40
-
41
-
42
-
43
-
44
-
45
-
46
-
47
-
48
-
49
-
50
-
51
-
52
-
53
-
54
-
55
-
56
-
57
-
58
-
59
-
60
-
61
-
62
-
63
-
64
-
65
-
66
-
67
-
68
-
69
-
70
-
71
-
72
-
73
-
74
-
75
-
76
-
77
-
78
-
79
-
80
-
81
-
82
-
83
-
84
-
85
-
86
-
87
-
88
-
89
-
90
-
91
-
92
-
93
-
94
-
95
-
96
-
97
-
98
-
99
-
100
-
101
-
102
-
103
-
104
-
105
-
106
-
107
-
108
-
109
-
110
-
111
-
112
-
113
-
114
-
115
-
116
-
117
-
118
-
119
-
120
-
121
-
122
-
123
-
124
-
125
-
126
-
127
-
128
-
129
-
130
-
131
-
132
-
133
-
134
-
135
-
136
-
137
-
138
-
139
-
140
-
141
-
142
-
143
-
144
-
145
-
146
-
147
-
148
-
149
-
150
-
151
-
152
-
153
-
154
-
155
-
156
-
157
-
158
-
159
-
160
-
161
-
162
-
163
-
164
-
165
-
166
-
167
-
168
-
169
-
170
-
171
-
172
-
173
-
174
-
175
-
176
-
 177
177 -
 178
178 -
 179
179 -
 180
180 -
 181
181 -
 182
182 -
 183
183 -
 184
184 -
 185
185 -
 186
186 -
 187
187 -
 188
188 -
 189
189 -
 190
190 -
 191
191 -
 192
192 -
 193
193 -
 194
194 -
 195
195 -
 196
196 -
 197
197 -
198
-
199
-
200
-
201
-
202
-
203
-
204
-
205
-
206
-
207
-
208
-
209
-
210
-
211
-
212
-
213
-
214
-
215
-
216
-
217
-
218
-
219
-
220
-
221
-
222
-
223
-
224
-
225
-
226
-
227
-
228
-
229
-
230
-
231
-
232
-
233
-
234
-
235
-
236
-
237
-
238
-
239
-
240
-
241
-
242
-
243
-
244
-
245
-
246
-
247
-
248
-
249
-
250
-
251
-
252
-
253
-
254
-
255
-
256
-
257
-
258
-
259
-
260
-
261
-
262
-
263
-
264
-
265
-
266
-
267
-
268
-
269
-
270
-
271
-
272
-
273
-
274
-
275
-
276
-
277
-
278
-
279
-
280
-
281
-
282
-
283
-
284
-
285
-
286
-
287
-
288
-
289
-
290
-
291
-
292
 |
 |

CONSOLIDATED FINANCIAL STATEMENTS
5
NOTES TO THE CONSOLIDATED FINANCIAL STATEMENTS
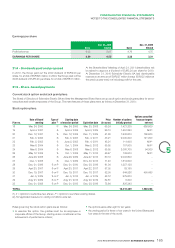
Earnings per share
Basic Dec.31, 2010
Diluted Basic Dec.31, 2009
Diluted
Profi t before tax 9.03 8.97 4.76 4.75
EARNINGS PER SHARE 6.59 6.55 3.32 3.31
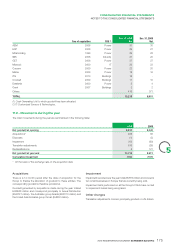
21.4 - Dividends paid and proposed
In 2010, the Group paid out the 2009 dividend of EUR2.05 per
share, for a total of EUR525million. In 2009, the Group paid out the
2008 dividend of EUR3.45 per share, for a total of EUR837million.
At the Shareholders’ Meeting of April21, 2011 shareholders will
be asked to approve a dividend of EUR3.20 per share for 2010.
At December31, 2010 Schneider Electric SA had distributable
reserves in an amount of EUR257million (versus EUR322million at
the previous year-end), not including profi t for the year.
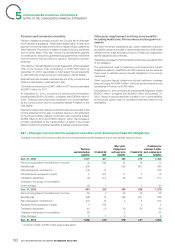
21.5 - Share-based payments
Current stock option and stock grant plans
The Board of Directors of Schneider Electric SA and later the Management Board have set up stock option and stock grant plans for senior
executives and certain employees of the Group. The main features of these plans were as follows at December31, 2010:
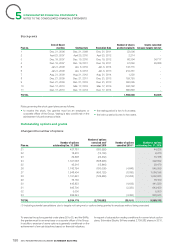
Stock option plans
Plan no. Date of Board
meeting Type of
plan(1)
Starting date
of exercise period Expiration date Price
(ineuros) Number of options
initially granted
Options cancelled
because targets
not met
18 Mar.24, 2000 P Mar.24, 2003 Mar.23, 2008 65.24 1,421,200 686,600
19 April4, 2001 S April4, 2005 April3, 2009 68.13 1,557,850 N/A(2)
20 Dec.12, 2001 S Dec.12, 2005 Dec.11, 2009 51.26 1,600,000 166,800
21 Feb.5, 2003 S Feb.5, 2007 Feb.4, 2011 45.21 2,000,000 141,900
22 Feb.5, 2003 S June5, 2003 Feb.4, 2011 45.21 111,000 N/A(2)
23 May6, 2004 S Oct.1, 2004 May5, 2012 55.55 107,000 N/A(2)
24 May6, 2004 S May6, 2008 May5, 2012 55.55 2,060,700 94,300
25 May12, 2005 S Oct.1, 2005 May11, 2013 56.47 138,500 N/A(2)
26 June28, 2005 S June28, 2009 June27, 2013 60.19 2,003,800 -
27 Dec.1, 2005 S Dec.1, 2009 Nov.30, 2013 71.40 1,614,900 -
28 Dec.21, 2006 S or P Dec.21, 2010 Dec.20, 2016 81.34 1,257,120 -
29 April23, 2007 S or P April23, 2011 April22, 2017 97.05 83,150 -
30 Dec.19, 2007 S or P Dec.19, 2011 Dec.18, 2017 92.00 944,926 490,463
31 Jan.5, 2009 S or P Jan.5, 2013 Jan.4, 2019 52.12 679,000 -
32 Aug.21, 2009 S or P Aug.21, 2013 Aug.20, 2019 62.61 5,000 -
33 Dec.21, 2009 S or P Dec.21, 2013 Dec.20, 2019 75.84 826,343 -
TOTAL 16,410,489 1,580,063
(1) S = Options to subscribe new shares. P = Options to purchase existing shares.
(2) Not applicable because no vesting conditions were set.
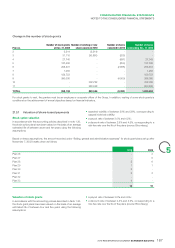
Rules governing the stock option plans are as follows:
•to exercise the option, the grantee must be an employee or
corporate offi cer of the Group. Vesting is also conditional on the
achievement of performance criteria;
•the options expire after eight to ten years;
•the vesting period is three or four years in the United States and
four years in the rest of the world.
2010 REGISTRATION DOCUMENT SCHNEIDER ELECTRIC 185