APC 2010 Annual Report Download - page 99
Download and view the complete annual report
Please find page 99 of the 2010 APC annual report below. You can navigate through the pages in the report by either clicking on the pages listed below, or by using the keyword search tool below to find specific information within the annual report.-
 1
1 -
2
-
3
-
4
-
5
-
6
-
7
-
8
-
9
-
10
-
11
-
12
-
13
-
14
-
15
-
16
-
17
-
18
-
19
-
20
-
21
-
22
-
23
-
24
-
25
-
26
-
27
-
28
-
29
-
30
-
31
-
32
-
33
-
34
-
35
-
36
-
37
-
38
-
39
-
40
-
41
-
42
-
43
-
44
-
45
-
46
-
47
-
48
-
49
-
50
-
51
-
52
-
53
-
54
-
55
-
56
-
57
-
58
-
59
-
60
-
61
-
62
-
63
-
64
-
65
-
66
-
67
-
68
-
69
-
70
-
71
-
72
-
73
-
74
-
75
-
76
-
77
-
78
-
79
-
80
-
81
-
82
-
83
-
84
-
85
-
86
-
87
-
88
-
 89
89 -
 90
90 -
 91
91 -
 92
92 -
 93
93 -
 94
94 -
 95
95 -
 96
96 -
 97
97 -
 98
98 -
 99
99 -
 100
100 -
 101
101 -
 102
102 -
 103
103 -
 104
104 -
 105
105 -
 106
106 -
 107
107 -
 108
108 -
 109
109 -
110
-
111
-
112
-
113
-
114
-
115
-
116
-
117
-
118
-
119
-
120
-
121
-
122
-
123
-
124
-
125
-
126
-
127
-
128
-
129
-
130
-
131
-
132
-
133
-
134
-
135
-
136
-
137
-
138
-
139
-
140
-
141
-
142
-
143
-
144
-
145
-
146
-
147
-
148
-
149
-
150
-
151
-
152
-
153
-
154
-
155
-
156
-
157
-
158
-
159
-
160
-
161
-
162
-
163
-
164
-
165
-
166
-
167
-
168
-
169
-
170
-
171
-
172
-
173
-
174
-
175
-
176
-
177
-
178
-
179
-
180
-
181
-
182
-
183
-
184
-
185
-
186
-
187
-
188
-
189
-
190
-
191
-
192
-
193
-
194
-
195
-
196
-
197
-
198
-
199
-
200
-
201
-
202
-
203
-
204
-
205
-
206
-
207
-
208
-
209
-
210
-
211
-
212
-
213
-
214
-
215
-
216
-
217
-
218
-
219
-
220
-
221
-
222
-
223
-
224
-
225
-
226
-
227
-
228
-
229
-
230
-
231
-
232
-
233
-
234
-
235
-
236
-
237
-
238
-
239
-
240
-
241
-
242
-
243
-
244
-
245
-
246
-
247
-
248
-
249
-
250
-
251
-
252
-
253
-
254
-
255
-
256
-
257
-
258
-
259
-
260
-
261
-
262
-
263
-
264
-
265
-
266
-
267
-
268
-
269
-
270
-
271
-
272
-
273
-
274
-
275
-
276
-
277
-
278
-
279
-
280
-
281
-
282
-
283
-
284
-
285
-
286
-
287
-
288
-
289
-
290
-
291
-
292
 |
 |

SUSTAINABLE DEVELOPMENT
INDICATORS
>
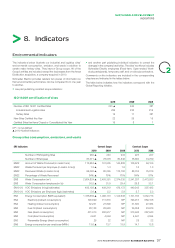
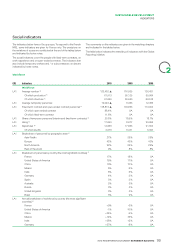
8. Indicators
Environmental indicators
ISO 14001 certification of sites
2010 2009 2008
Number of ISO 14001 Certifi ed Sites 251 ▲244 NP
Industrial and Logistics sites 236 233 216
Tertiary Sites 15 11 NP
New Sites Certifi ed this Year 22 25 15
Certifi ed Sites that have Closed or Consolidated this Year 15 8 1
NP = not published
▲ 2010 Audited Indicators
The indicators below illustrate our industrial and logistics sites’
environmental consumption, emission, and waste in addition to
certain major tertiary sites. They have a Group scope. All of the
Group’s entities are included, except the businesses from the Areva
Distribution acquisition, a company acquired in 2010.
Schneider Electric provides readers two pieces of information so
that environmental performance can be compared from one year
to another.
•one part publishing constant scope indicators;
•and another part publishing individual indicators to correct the
changes in the company’s activities. The sites’ workforce includes
Schneider Electric employees (Fixed-term, Open-ended, Work-
study participants), temporary staff, and on-site subcontractors.
Comments on the indicators are included in the corresponding
chapters and indicated in the tables below.
The table below indicates how the indicators correspond with the
Global Reporting Initiative.
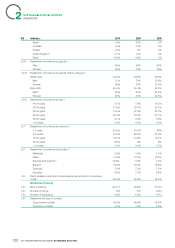
Group sites consumption, emissions, and waste
GRI indicators Current Scope Constant Scope
2010 2009 2008 2010 2009
Number of Participating Sites 255 ▲240 234 227 227
Number of Employees 87,371 ▲78,078 80,846 78,550 74,769
EN22 Amount of Waste Produced (in metric tons) 113,684 ▲101,535 144,888 105,675 94,105
EN22 Waste Produced per Employee (in metric tons/p) 1.3 ▲ 1.3 1.8 1.3 1.3
EN22 Recovered Waste (in metric tons) 95,092 ▲80,255 113,182 88,704 75,816
EN22 Percentage of Waste Recovered 84% ▲ 79% 78% 84% 81%
EN8 Water Consumption (m3) 2,664,824 ▲ 2,493,351 2,374,035 2,341,287 2,473,583
EN8 Water Consumption/employee (m3/p) 30.5 ▲31.9 29.4 29.8 33.1
EN19-20 VOC Emissions (in kg) (estimates) 492,192 ▲409,219 479,172 449,243 397,492
EN19-20 VOC Emissions per Employee (kg/p) (estimates) 5.6 ▲5.2 5.9 5.7 5.3
EN3 Energy Consumption (MWh equivalent) 1,186,864 ▲ 1,066,173 1,124,638 1,101,183 1,032,775
EN4 Electricity (indirect consumption) 790,829 711,815 NP 725,917 689,156
EN4 Heating (indirect consumption) 32,231 27,899 NP 31,300 27,084
EN3 Fuel Oil (direct consumption) 28,128 28,926 NP 25,358 23,976
EN3 Gas (direct consumption) 331,010 292,917 NP 313,942 287,943
EN3 Coal (direct consumption) 4,641 4,594 NP 4,641 4,594
EN3 Renewable Energy (direct consumption) 25 22 NP 25 22
EN5 Energy consumption per employee (MWh) 13.6 ▲ 13.7 13.9 14.1 13.8
2010 REGISTRATION DOCUMENT SCHNEIDER ELECTRIC 97
2