APC 2010 Annual Report Download - page 92
Download and view the complete annual report
Please find page 92 of the 2010 APC annual report below. You can navigate through the pages in the report by either clicking on the pages listed below, or by using the keyword search tool below to find specific information within the annual report.-
 1
1 -
2
-
3
-
4
-
5
-
6
-
7
-
8
-
9
-
10
-
11
-
12
-
13
-
14
-
15
-
16
-
17
-
18
-
19
-
20
-
21
-
22
-
23
-
24
-
25
-
26
-
27
-
28
-
29
-
30
-
31
-
32
-
33
-
34
-
35
-
36
-
37
-
38
-
39
-
40
-
41
-
42
-
43
-
44
-
45
-
46
-
47
-
48
-
49
-
50
-
51
-
52
-
53
-
54
-
55
-
56
-
57
-
58
-
59
-
60
-
61
-
62
-
63
-
64
-
65
-
66
-
67
-
68
-
69
-
70
-
71
-
72
-
73
-
74
-
75
-
76
-
77
-
78
-
79
-
80
-
81
-
 82
82 -
 83
83 -
 84
84 -
 85
85 -
 86
86 -
 87
87 -
 88
88 -
 89
89 -
 90
90 -
 91
91 -
 92
92 -
 93
93 -
 94
94 -
 95
95 -
 96
96 -
 97
97 -
 98
98 -
 99
99 -
 100
100 -
 101
101 -
 102
102 -
103
-
104
-
105
-
106
-
107
-
108
-
109
-
110
-
111
-
112
-
113
-
114
-
115
-
116
-
117
-
118
-
119
-
120
-
121
-
122
-
123
-
124
-
125
-
126
-
127
-
128
-
129
-
130
-
131
-
132
-
133
-
134
-
135
-
136
-
137
-
138
-
139
-
140
-
141
-
142
-
143
-
144
-
145
-
146
-
147
-
148
-
149
-
150
-
151
-
152
-
153
-
154
-
155
-
156
-
157
-
158
-
159
-
160
-
161
-
162
-
163
-
164
-
165
-
166
-
167
-
168
-
169
-
170
-
171
-
172
-
173
-
174
-
175
-
176
-
177
-
178
-
179
-
180
-
181
-
182
-
183
-
184
-
185
-
186
-
187
-
188
-
189
-
190
-
191
-
192
-
193
-
194
-
195
-
196
-
197
-
198
-
199
-
200
-
201
-
202
-
203
-
204
-
205
-
206
-
207
-
208
-
209
-
210
-
211
-
212
-
213
-
214
-
215
-
216
-
217
-
218
-
219
-
220
-
221
-
222
-
223
-
224
-
225
-
226
-
227
-
228
-
229
-
230
-
231
-
232
-
233
-
234
-
235
-
236
-
237
-
238
-
239
-
240
-
241
-
242
-
243
-
244
-
245
-
246
-
247
-
248
-
249
-
250
-
251
-
252
-
253
-
254
-
255
-
256
-
257
-
258
-
259
-
260
-
261
-
262
-
263
-
264
-
265
-
266
-
267
-
268
-
269
-
270
-
271
-
272
-
273
-
274
-
275
-
276
-
277
-
278
-
279
-
280
-
281
-
282
-
283
-
284
-
285
-
286
-
287
-
288
-
289
-
290
-
291
-
292
 |
 |

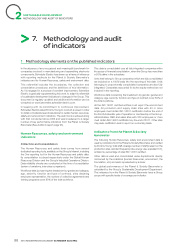
SUSTAINABLE DEVELOPMENT
2METHODOLOGY ANDAUDIT OFINDICATORS
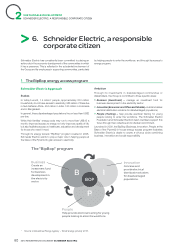
1,000,000 households at the Base of the Pyramid
have access to energy thanks to Schneider Electric
solutions
Households at the base of the pyramid taken into account by this
indicator are those that have incomes under USD3,000 per annum
in purchasing power parity.
The indicator measures the sales of prepayment meters sold by
Conlog, a subsidiary of Schneider Electric, to electrical distribution
companies in Africa, enabling households to connect to the grid
who were not able to do so previously. A drop of 20% to this fi gure
is applied to remove the new connections due to new housing
constructions for households not belonging to the base of the
pyramid.
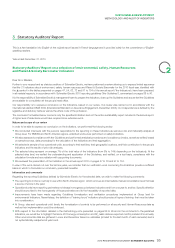
60% of our purchases from suppliers who support
the Global Compact
The Global Compact is a United Nations initiative aimed at involving
businesses in observing the ten universal principles, in the areas of
human rights, labor, environment and anti-corruption.
Businesses which support the Global Compact publicly undertake
with the United Nations to constantly improve their actions in favor
of the ten Principles and to annually communicate the efforts made
during the year.
This indicator measures the share of the volume of purchases from
suppliers listed by Schneider Electric, along with those who support
the Global Compact or equivalent. For electronic businesses, the
Electronic Industry Code of Conduct (EICC) is considered as
equivalent to the Global Compact and is incorporated as such into
the indicator. The suppliers listed by Schneider Electric represent x%
of total purchases of the Group in 2010.
This indicator was audited by Ernst & Young.
4 major ethical stock indexes select Schneider
Electric
The indicator measures the presence of Schneider Electric in the
following four ethical stock market indices:
•the Dow Jones Sustainability Index (DJSI) World;
•the Dow Jones Sustainability Index (DJSI) Europe;
•the Advanced Sustainable Performance Index (ASPI) Eurozone;
•the FTSE4Good.
This indicator was audited by Ernst & Young.
10% annual decrease in the frequency rate of
occupational accidents
The lost time injury frequency rate corresponds to the number of
accidents resulting in more than one day of lost work over a period
of twelve months per millions hours worked. All accidents reported
on Schneider Electric sites are counted (including therefore accident
affecting subcontractors on site and temporary workers).
This indicator was audited by Ernst & Young.
14points increase in the Company’s employee
recommendation score
This indicator measures the results of quarterly surveys among a
quarter of the Group’s partners (those on fi xed-term contracts –
including work-study participants – and on open-ended contracts).
The Partners Recommendation Score (Employee Net Promoter
Score) is measured with the question “To what extent would you
recommend Schneider Electric to your friends as being a business
where it is pleasant to work?” Polls are considered as “in favor of”,
“undecided” or “against”, depending on the rating they select on a
scale from0 to10. The indicator measures the difference between
those who are for and those who are against. This methodology is
also used for the Customer Net Promoter Score.
This indicator was audited by Ernst & Young.
2,000employees trained on energy management
solutions
The indicator counts the employees haven taken one of the internal
or external training courses aimed at training specialists in energy
management:
•a generalist training on energy effi ciency (in-class and e-learning).
The CEM certifi cation program (Certifi ed Energy Manager) issued
by an external certifi cation body is accepted as equivalent and
included in the indicator;
•a training path including a general phase on energy effi ciency,
then a specialisation phase (marketing, sales, customer projects
management, etc.) requiring functional skills, a knowledge of
solution segments and experience with customers.
In 2009, the indicator counted solely employees taking part in the
courses offered.
This indicator was audited by Ernst & Young.
10,000 young people at the Base of the Pyramid
trained in the energy management professions
Young people from the base of the pyramid taken into account by
this indicator are those that come from a household with an income
under USD3,000 per annum in purchasing power parity.
The indicator counts students undergoing training by Schneider
Electric (supplying equipment or equipment with added technical
and teaching expertise).
A student is only counted once in the indicator.
500new entrepreneurs from the Base of the
Pyramid start their own business in the area of
energy management
Entrepreneurs from the base of the pyramid are people with no
access to the banking system and traditional credit organisations to
fi nance the creation of their business.
The indicator counts people creating their business in the area
of energy management (electricians, small fi tters, etc.) who avail
themselves of microcredit and support in business creation and
management by a specialised association fi nanced by Schneider
Electric. Schneider Electric also offers support to its vendors including
in particular equipment and technical and marketing support.
An entrepreneur is only counted once in the indicator.
2010 REGISTRATION DOCUMENT SCHNEIDER ELECTRIC90