APC 2010 Annual Report Download - page 21
Download and view the complete annual report
Please find page 21 of the 2010 APC annual report below. You can navigate through the pages in the report by either clicking on the pages listed below, or by using the keyword search tool below to find specific information within the annual report.-
 1
1 -
2
-
3
-
4
-
5
-
6
-
7
-
8
-
9
-
10
-
 11
11 -
 12
12 -
 13
13 -
 14
14 -
 15
15 -
 16
16 -
 17
17 -
 18
18 -
 19
19 -
 20
20 -
 21
21 -
 22
22 -
 23
23 -
 24
24 -
 25
25 -
 26
26 -
 27
27 -
 28
28 -
 29
29 -
 30
30 -
 31
31 -
32
-
33
-
34
-
35
-
36
-
37
-
38
-
39
-
40
-
41
-
42
-
43
-
44
-
45
-
46
-
47
-
48
-
49
-
50
-
51
-
52
-
53
-
54
-
55
-
56
-
57
-
58
-
59
-
60
-
61
-
62
-
63
-
64
-
65
-
66
-
67
-
68
-
69
-
70
-
71
-
72
-
73
-
74
-
75
-
76
-
77
-
78
-
79
-
80
-
81
-
82
-
83
-
84
-
85
-
86
-
87
-
88
-
89
-
90
-
91
-
92
-
93
-
94
-
95
-
96
-
97
-
98
-
99
-
100
-
101
-
102
-
103
-
104
-
105
-
106
-
107
-
108
-
109
-
110
-
111
-
112
-
113
-
114
-
115
-
116
-
117
-
118
-
119
-
120
-
121
-
122
-
123
-
124
-
125
-
126
-
127
-
128
-
129
-
130
-
131
-
132
-
133
-
134
-
135
-
136
-
137
-
138
-
139
-
140
-
141
-
142
-
143
-
144
-
145
-
146
-
147
-
148
-
149
-
150
-
151
-
152
-
153
-
154
-
155
-
156
-
157
-
158
-
159
-
160
-
161
-
162
-
163
-
164
-
165
-
166
-
167
-
168
-
169
-
170
-
171
-
172
-
173
-
174
-
175
-
176
-
177
-
178
-
179
-
180
-
181
-
182
-
183
-
184
-
185
-
186
-
187
-
188
-
189
-
190
-
191
-
192
-
193
-
194
-
195
-
196
-
197
-
198
-
199
-
200
-
201
-
202
-
203
-
204
-
205
-
206
-
207
-
208
-
209
-
210
-
211
-
212
-
213
-
214
-
215
-
216
-
217
-
218
-
219
-
220
-
221
-
222
-
223
-
224
-
225
-
226
-
227
-
228
-
229
-
230
-
231
-
232
-
233
-
234
-
235
-
236
-
237
-
238
-
239
-
240
-
241
-
242
-
243
-
244
-
245
-
246
-
247
-
248
-
249
-
250
-
251
-
252
-
253
-
254
-
255
-
256
-
257
-
258
-
259
-
260
-
261
-
262
-
263
-
264
-
265
-
266
-
267
-
268
-
269
-
270
-
271
-
272
-
273
-
274
-
275
-
276
-
277
-
278
-
279
-
280
-
281
-
282
-
283
-
284
-
285
-
286
-
287
-
288
-
289
-
290
-
291
-
292
 |
 |

DESCRIPTION OFTHEGROUP, ANDITSSTRATEGY, MARKETS ANDBUSINESSES
1
GLOBAL SPECIALIST IN ENERGY MANAGEMENT
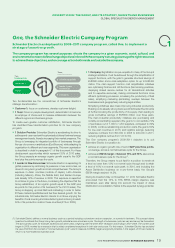
One, the Schneider Electric Company Program
Schneider Electric has deployed its 2009-2011 company program, called One, to implement a
strategy of assertive growth.
The company program has several purposes: situate the company in a given economic, social, cultural, and
environmental context; define change objectives in line with the company’s strategy; leverage the right resources
to achieve these objectives, and encourage action both inside and outside the company.
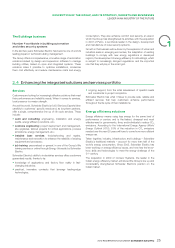
Three
transformations
customer 1
1 team
solution provider
leader in new
economies
company
1
1
1
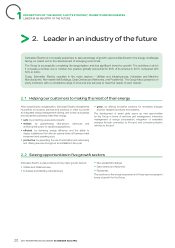
Two
fundamentals
Two fundamentals are the cornerstones of Schneider Electric’s
strategic transformation:
•Customer 1: focus on customers, develop customer delight;
•1 Team: focus on people development, determination to become
an employer of choice and to increase collaboration between the
different regions and business groups.
To create even greater customer satisfaction, Schneider Electric
has identifi ed three transformation priorities for its new company
program:
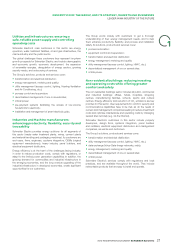
•1 Solution Provider: Schneider Electric is accelerating its drive to
address end-user needs with customised solutions that meet energy
management needs, thereby increasing their market presence. The
Group is leveraging its integrated portfolio of businesses through
the use of a common architecture (EcoStruxure), while adapting its
organisation to different end-user segments. This new organisation
is described in detail in paragraph 4.1 of this document. For these
development opportunities which represent 33% of 2010 sales,
the Group expects an average organic growth equal to the GDP
level plus fi ve points accross the cycle.
•1 Leader in New Economies: Schneider Electric is expanding its
global presence by reinforcing its presence in new economies, as
drivers for long-term growth and cost competitiveness. The Group’s
exposure in Asian countries (outside of Japan), Latin America
(including Mexico), Africa, the Middle East, and Eastern Europe
was already 32% of revenue in 2008. This exposure is expected
to continue to grow in the future, considering the objective that the
Group established, of an organic growth equal to the GDP plus
six points for this portion of its business (37% of 2010 sales). The
Group is stepping up local R&D and marketing in order to better
fi t these markets specifi cities and fuel their desired growth. On the
industrial side, Schneider Electric intends to continue enjoying the
benefi ts of local sourcing and manufacturing and is striving to reach
50% of its production costs in these countries (41% in 2008);
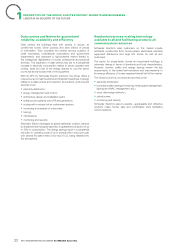
•1 Company: Signifi cation is a pre-requisite for many of the Group’s
strategic ambitions. It will be achieved through the simplifi cation of
support functions, with the goal to generate structural savings of
EUR600 million and a crisis adaptation option for up to EUR400
million. The main support function cost simplifi cation initiatives
are: optimising Finance and HR functions (harmonising practices,
deploying shared service centres for all transactional activities
and for expertise resources), making commercial functions more
effi cient (optimising processus, increasing the productivity of fi eld
sales), simplifying marketing (eliminating overlaps between the
businesses and geographies), reducing legal entities.
Simplifying initiatives also mean improving industrial productivity.
Building on its already strong track record Schneider Electric aims
at further boosting the productivity of its supply chain leading to
gross cumulative savings of EUR600 million over three years.
The main industrial productivity initiatives are: purchasing and
notably concentrating suppliers (the goal is to concentrate 70%
of purchases out of 1,000 to 1,200 suppliers, compared to 39%
in 2008), continue rebalancing production costs (the goal is 50%
for low-cost countries in 2011) and logistics savings (reducing
reference numbers from 800,000 in 2008 to 400,000 in 2011,
reducing logistics centres from 140 to 80).
The One company program’s 2009-2011 objective is to put
Schneider Electric in a position to:
•achieve an organic growth rate of world GDP plus three points,
on average, across a normal business cycle for the Group,
•achieve an EBITA margin of between 13% and 16%, also across
a normal business cycle for the Group(1).
Therefore, the Group means to put itself in a position to remain at
a level no lower than 13% in a normal cycle through and to attain
a level of 16% in a normal cycle peak. In 2010, and including the
Areva Distribution business on a pro-forma basis, the Group’s
EBITA margin reached 14.5%.
During its Investor’s Day on November 17, 2010 Schneider Electric
announced that this 13% to 16% EBITA margin objective was
maintained, even after taking into account the impact of Areva
Distribution’s consolidation, thanks to the expected synergy potential.
(1) Schneider Electric defi nes a normal business cycle as a period including a slowdown and an expansion, or a period in between. This concept allows
investors to estimate the Group’s long-term growth potential across a business cycle. The length of a business cycle can vary and cannot be forecasted.
The last business cycle, for example, lasted around seven years, beginning with the 2000-2001 recession and ending in 2007-2008. The current cycle
began in 2009, marked by a recession that is widely considered exceptional in both size and scope. For this reason, Schneider Electric has excluded
the year 2009 from the concept of “normal business cycle” used to measure its EBITA margin and growth potential. In this regard, 2010 has marked a
return to a more traditional business cycle.
2010 REGISTRATION DOCUMENT SCHNEIDER ELECTRIC 19