APC 2010 Annual Report Download - page 103
Download and view the complete annual report
Please find page 103 of the 2010 APC annual report below. You can navigate through the pages in the report by either clicking on the pages listed below, or by using the keyword search tool below to find specific information within the annual report.-
 1
1 -
2
-
3
-
4
-
5
-
6
-
7
-
8
-
9
-
10
-
11
-
12
-
13
-
14
-
15
-
16
-
17
-
18
-
19
-
20
-
21
-
22
-
23
-
24
-
25
-
26
-
27
-
28
-
29
-
30
-
31
-
32
-
33
-
34
-
35
-
36
-
37
-
38
-
39
-
40
-
41
-
42
-
43
-
44
-
45
-
46
-
47
-
48
-
49
-
50
-
51
-
52
-
53
-
54
-
55
-
56
-
57
-
58
-
59
-
60
-
61
-
62
-
63
-
64
-
65
-
66
-
67
-
68
-
69
-
70
-
71
-
72
-
73
-
74
-
75
-
76
-
77
-
78
-
79
-
80
-
81
-
82
-
83
-
84
-
85
-
86
-
87
-
88
-
89
-
90
-
91
-
92
-
 93
93 -
 94
94 -
 95
95 -
 96
96 -
 97
97 -
 98
98 -
 99
99 -
 100
100 -
 101
101 -
 102
102 -
 103
103 -
 104
104 -
 105
105 -
 106
106 -
 107
107 -
 108
108 -
 109
109 -
 110
110 -
 111
111 -
 112
112 -
 113
113 -
114
-
115
-
116
-
117
-
118
-
119
-
120
-
121
-
122
-
123
-
124
-
125
-
126
-
127
-
128
-
129
-
130
-
131
-
132
-
133
-
134
-
135
-
136
-
137
-
138
-
139
-
140
-
141
-
142
-
143
-
144
-
145
-
146
-
147
-
148
-
149
-
150
-
151
-
152
-
153
-
154
-
155
-
156
-
157
-
158
-
159
-
160
-
161
-
162
-
163
-
164
-
165
-
166
-
167
-
168
-
169
-
170
-
171
-
172
-
173
-
174
-
175
-
176
-
177
-
178
-
179
-
180
-
181
-
182
-
183
-
184
-
185
-
186
-
187
-
188
-
189
-
190
-
191
-
192
-
193
-
194
-
195
-
196
-
197
-
198
-
199
-
200
-
201
-
202
-
203
-
204
-
205
-
206
-
207
-
208
-
209
-
210
-
211
-
212
-
213
-
214
-
215
-
216
-
217
-
218
-
219
-
220
-
221
-
222
-
223
-
224
-
225
-
226
-
227
-
228
-
229
-
230
-
231
-
232
-
233
-
234
-
235
-
236
-
237
-
238
-
239
-
240
-
241
-
242
-
243
-
244
-
245
-
246
-
247
-
248
-
249
-
250
-
251
-
252
-
253
-
254
-
255
-
256
-
257
-
258
-
259
-
260
-
261
-
262
-
263
-
264
-
265
-
266
-
267
-
268
-
269
-
270
-
271
-
272
-
273
-
274
-
275
-
276
-
277
-
278
-
279
-
280
-
281
-
282
-
283
-
284
-
285
-
286
-
287
-
288
-
289
-
290
-
291
-
292
 |
 |

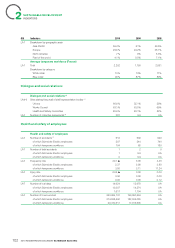
SUSTAINABLE DEVELOPMENT
INDICATORS
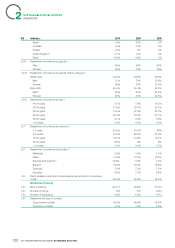
GRI Indicators 2010 2009 2008
LA1 Breakdown by occupational category
Manual workers 30.2% 31.1% 32.4%
Foremen 1.3% 1.3% 1.0%
Administrators and technicians 31.9% 32.0% 30.9%
Engineers and executives 32.7% 32.7% 31.9%
Work experience 3.9% 2.9% 3.8%
Breakdown by gender(7)
Men 66.8% 66.2% 64.5%
Women 33.2% 33.8% 35.5%
Hiring
(6)
LA2 Breakdown by type of contract
Open-ended contract 58.5% 56.6% 65%
Fixed-term contract 41.5% 43.4% 35%
LA2 Breakdown by category
White collar 41.1% 40% 47%
Blue collar 58.9% 60% 53%
LA2 Breakdown by geographic area
Asia-Pacifi c 45% 43% 34%
Europe 20% 20% 31%
North America 12% 13% 25%
Rest of the world 23% 24% 10%
Layoffs
(6)
LA2 Breakdown by type of contract
Open-ended contract 75% 91% 84.3%
Fixed-term contract 25% 9% 15.7%
LA2 Breakdown by category
White collar 39% 44% 46.7%
Blue collar 61% 56% 53.3%
LA2 Breakdown by geographic area
Asia-Pacifi c 11% 12% 8%
Europe 31% 37% 32%
North America 42% 40% 51%
Rest of the world 16% 11% 9%
Resignations
(6)(8)
LA2 Breakdown by seniority(2)
< 1 year 33.8% UA UA
1/4years 45% UA UA
5/14years 18.1% UA UA
15/24years 2.2% UA UA
25/34years 0.7% UA UA
> 34years 0.2% UA UA
Average temporary workforce
LA1 Breakdown by category
White collar 12.5% 19.5% 23.5%
Blue collar 87.5% 80.5% 76.5%
2010 REGISTRATION DOCUMENT SCHNEIDER ELECTRIC 101
2