APC 2010 Annual Report Download - page 69
Download and view the complete annual report
Please find page 69 of the 2010 APC annual report below. You can navigate through the pages in the report by either clicking on the pages listed below, or by using the keyword search tool below to find specific information within the annual report.-
 1
1 -
2
-
3
-
4
-
5
-
6
-
7
-
8
-
9
-
10
-
11
-
12
-
13
-
14
-
15
-
16
-
17
-
18
-
19
-
20
-
21
-
22
-
23
-
24
-
25
-
26
-
27
-
28
-
29
-
30
-
31
-
32
-
33
-
34
-
35
-
36
-
37
-
38
-
39
-
40
-
41
-
42
-
43
-
44
-
45
-
46
-
47
-
48
-
49
-
50
-
51
-
52
-
53
-
54
-
55
-
56
-
57
-
58
-
 59
59 -
 60
60 -
 61
61 -
 62
62 -
 63
63 -
 64
64 -
 65
65 -
 66
66 -
 67
67 -
 68
68 -
 69
69 -
 70
70 -
 71
71 -
 72
72 -
 73
73 -
 74
74 -
 75
75 -
 76
76 -
 77
77 -
 78
78 -
 79
79 -
80
-
81
-
82
-
83
-
84
-
85
-
86
-
87
-
88
-
89
-
90
-
91
-
92
-
93
-
94
-
95
-
96
-
97
-
98
-
99
-
100
-
101
-
102
-
103
-
104
-
105
-
106
-
107
-
108
-
109
-
110
-
111
-
112
-
113
-
114
-
115
-
116
-
117
-
118
-
119
-
120
-
121
-
122
-
123
-
124
-
125
-
126
-
127
-
128
-
129
-
130
-
131
-
132
-
133
-
134
-
135
-
136
-
137
-
138
-
139
-
140
-
141
-
142
-
143
-
144
-
145
-
146
-
147
-
148
-
149
-
150
-
151
-
152
-
153
-
154
-
155
-
156
-
157
-
158
-
159
-
160
-
161
-
162
-
163
-
164
-
165
-
166
-
167
-
168
-
169
-
170
-
171
-
172
-
173
-
174
-
175
-
176
-
177
-
178
-
179
-
180
-
181
-
182
-
183
-
184
-
185
-
186
-
187
-
188
-
189
-
190
-
191
-
192
-
193
-
194
-
195
-
196
-
197
-
198
-
199
-
200
-
201
-
202
-
203
-
204
-
205
-
206
-
207
-
208
-
209
-
210
-
211
-
212
-
213
-
214
-
215
-
216
-
217
-
218
-
219
-
220
-
221
-
222
-
223
-
224
-
225
-
226
-
227
-
228
-
229
-
230
-
231
-
232
-
233
-
234
-
235
-
236
-
237
-
238
-
239
-
240
-
241
-
242
-
243
-
244
-
245
-
246
-
247
-
248
-
249
-
250
-
251
-
252
-
253
-
254
-
255
-
256
-
257
-
258
-
259
-
260
-
261
-
262
-
263
-
264
-
265
-
266
-
267
-
268
-
269
-
270
-
271
-
272
-
273
-
274
-
275
-
276
-
277
-
278
-
279
-
280
-
281
-
282
-
283
-
284
-
285
-
286
-
287
-
288
-
289
-
290
-
291
-
292
 |
 |

SUSTAINABLE DEVELOPMENT
SCHNEIDER ELECTRIC’S COMMITMENT TOENVIRONMENTAL PERFORMANCE
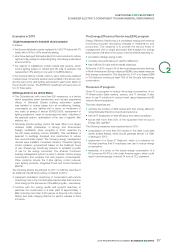
Examples in 2010
1] Light management in industrial sites (examples)
In France:
•the Evreux distribution center replaced its 3,000 T8 tubes with T5
tubes with a 30% to 45% electricity saving;
•sites have deployed Schneider Electric’s Lubio solution to reduce
night and day voltage for external lighting. The saving is estimated
at around 20%;
•the majority of installations contain natural light sensors, which
control lighting based on natural light. By way of example, this
represents a 14% saving in one year in the MGA factory.
In the Chennai factory in India, mercury vapor bulbs were replaced
in warehouses, movement sensors were installed in the server room
and the rest rooms, and lighting was added to each work station in
the production zones. The EUR3300 investment will see a return in
two to three years.
2] Energy Action in the United States
•The Columbia site, with more than 550employees, is a factory
which assembles smart transformers and includes engineering
offi ces. A Schneider Electric building automation system
was installed to reduce losses from air conditioning, heating,
compressed air, and lighting with a return on investment of
two years (a saving of almost EUR220,000): replacement of
lighting equipment, repair of compressed air leaks, reduction of
the pressure system, optimisation of the use of regulator fi lter
stations, etc. ;
•Schneider Electric lighting control US head offi ce in La Vergne
obtained LEED (Leadership in Energy and Environment
Design) certifi cation (silver program) in 2010, awarded by
the US Green Building Council (USGBC). This certifi cation is
awarded to buildings designed and constructed to reduce
their environmental impact. The following energy management
devices were installed: movement sensors, Powerlink lighting
control systems, programmed based on the building’s hours
of use, PowerLogic monitoring systems to establish a profi le
of use for the energy consumed. The Andover Continuum
building management system is used to directly monitor energy
consumption and compare this with previous consumptions.
Other solutions include the C-Bus lighting control network,
Juno lighting products, Integrated Power and Control Solutions
(IPaCS).
The following actions are planned for 2011 to fulfi ll the objective of
an additional 4% effi ciency saving compared to 2010:
•implement centralised monitoring of consumption with remote
monitoring tools in the 100 Schneider Electric sites that consume
most energy (in the framework of the EEM program – see below);
•continue with the energy audits and projects launched, in
particular the construction of a solar plant of approximately 1
MW, including more than 3,500 panels, at Smyrna in the United
States, and solar charging stations for electric vehicles in Paris
in France.
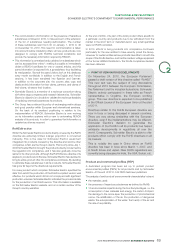
The Energy Efficiency Monitoring (EEM) program
Energy Effi ciency Monitoring is a centralised energy performance
monitoring program (excluding changes in temperature and
production). The objective is to provide the various levels of
management with a single scorecard that displays the energy
performance of all sites in the scope of environmental reporting to:
•accurately manage energy costs;
•compare site performance to identify ineffi ciency;
•help fulfi ll the Group’s environmental objectives.
At the end of 2010, close to 60 of the most energy intensive factories
in North America and Europe deployed EEM to accurately measure
their energy consumption. The objective for 2011 is to deploy EEM
in 100 factories covering at least 75% of the Group’s total energy
consumption.
The Green IT program
Green IT is a program to reduce the energy consumption of our
IT infrastructure (data centers, servers, and IT devices). It also
aims to use IT solutions to reduce travel using telepresence/HD
videoconferencing systems.
The main objectives are:
•optimise the number of data centers and their energy effi ciency
using Schneider Electric products and solutions;
•train all IT employees on best effi ciency and carbon practices;
•ensure that more than 80% of the equipment that we buy is
Energy Star qualifi ed.
The following measures were implemented in 2010:
•consolidation of more than 500servers in the Saint Louis data
center (United States), which should generate almost 1.5GWh
of savings in 2010;
•deployment of a Green IT Playbook, which is a reference for
the best practices that IT employees can use to reduce energy
consumption;
•leadership of a study on the typical energy consumption of a
PC (covering 400PCs) in the Latin America region, which could
result in annual savings of almost 14tons of CO2 equivalent.
2010 REGISTRATION DOCUMENT SCHNEIDER ELECTRIC 67
2