APC 2010 Annual Report Download - page 143
Download and view the complete annual report
Please find page 143 of the 2010 APC annual report below. You can navigate through the pages in the report by either clicking on the pages listed below, or by using the keyword search tool below to find specific information within the annual report.-
 1
1 -
2
-
3
-
4
-
5
-
6
-
7
-
8
-
9
-
10
-
11
-
12
-
13
-
14
-
15
-
16
-
17
-
18
-
19
-
20
-
21
-
22
-
23
-
24
-
25
-
26
-
27
-
28
-
29
-
30
-
31
-
32
-
33
-
34
-
35
-
36
-
37
-
38
-
39
-
40
-
41
-
42
-
43
-
44
-
45
-
46
-
47
-
48
-
49
-
50
-
51
-
52
-
53
-
54
-
55
-
56
-
57
-
58
-
59
-
60
-
61
-
62
-
63
-
64
-
65
-
66
-
67
-
68
-
69
-
70
-
71
-
72
-
73
-
74
-
75
-
76
-
77
-
78
-
79
-
80
-
81
-
82
-
83
-
84
-
85
-
86
-
87
-
88
-
89
-
90
-
91
-
92
-
93
-
94
-
95
-
96
-
97
-
98
-
99
-
100
-
101
-
102
-
103
-
104
-
105
-
106
-
107
-
108
-
109
-
110
-
111
-
112
-
113
-
114
-
115
-
116
-
117
-
118
-
119
-
120
-
121
-
122
-
123
-
124
-
125
-
126
-
127
-
128
-
129
-
130
-
131
-
132
-
 133
133 -
 134
134 -
 135
135 -
 136
136 -
 137
137 -
 138
138 -
 139
139 -
 140
140 -
 141
141 -
 142
142 -
 143
143 -
 144
144 -
 145
145 -
 146
146 -
 147
147 -
 148
148 -
 149
149 -
 150
150 -
 151
151 -
 152
152 -
 153
153 -
154
-
155
-
156
-
157
-
158
-
159
-
160
-
161
-
162
-
163
-
164
-
165
-
166
-
167
-
168
-
169
-
170
-
171
-
172
-
173
-
174
-
175
-
176
-
177
-
178
-
179
-
180
-
181
-
182
-
183
-
184
-
185
-
186
-
187
-
188
-
189
-
190
-
191
-
192
-
193
-
194
-
195
-
196
-
197
-
198
-
199
-
200
-
201
-
202
-
203
-
204
-
205
-
206
-
207
-
208
-
209
-
210
-
211
-
212
-
213
-
214
-
215
-
216
-
217
-
218
-
219
-
220
-
221
-
222
-
223
-
224
-
225
-
226
-
227
-
228
-
229
-
230
-
231
-
232
-
233
-
234
-
235
-
236
-
237
-
238
-
239
-
240
-
241
-
242
-
243
-
244
-
245
-
246
-
247
-
248
-
249
-
250
-
251
-
252
-
253
-
254
-
255
-
256
-
257
-
258
-
259
-
260
-
261
-
262
-
263
-
264
-
265
-
266
-
267
-
268
-
269
-
270
-
271
-
272
-
273
-
274
-
275
-
276
-
277
-
278
-
279
-
280
-
281
-
282
-
283
-
284
-
285
-
286
-
287
-
288
-
289
-
290
-
291
-
292
 |
 |

BUSINESS REVIEW
4
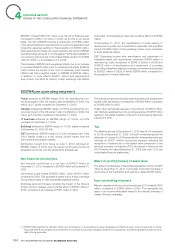
TRENDS IN SCHNEIDER ELECTRIC’S CORE MARKETS
Utilities and Infrastructures
Electric power
After a year of contraction in the mature countries in particular,
the Electric power market made signifi cant progress in 2010 with
estimated growth of between +6% and +8% in electric utilities
mainly fueled by the emerging markets led by China and Asia with
double-digit growth. The underlying growth factors remained the
increase in demand in the emerging countries and work on improving
electricity networks mainly in North America and Eastern Europe.
Intelligent networks are also taking shape with the launch of pilot and
experimental projects supported by national spending programs, in
particular for automated distribution systems the market for which
can be expected to experience average of double-digit annual
growth by 2015.
The environment remains a leading preoccupation for the electric
power segment. The commitments made by governments worldwide
remain inadequate but will nevertheless have a suffi ciently strong
impact on capital spending in the sector for them already to have
been integrated to the scenarios elaborated by the International
Energy Agency.
Oil and gas
After a return to growth in the second part of 2009, the price of oil
continued to rise throughout 2010 (+26%) until it reached its level
of January2008, thereby triggering new investment in the sector
in 2010 (+4%) compared with the sharp fall of 2009 (-7%). This
trend in investment, albeit still below the level of 2008, is expected
to continue in 2011 and beyond, particularly if the oil price remains
high, thereby covering the high marginal cost of development of
new oilfi elds linked to the extreme complexity of the exploration and
production environments.
Data centres and Networks
2010 was a year of rebound for IT business with solid growth driven
by Asia and the Americas.
The fundamental global drivers for data centre and network physical
infrastructure continue to remain valid.
The strong 2010 growth in IT global markets will continue in 2011.
As the cost of IT becomes more signifi cant and visible, the industry
is focused on effi ciencies – energy costs, compute density and use
of physical space. This is driving the market towards dynamic and
modular infrastructure, integrated management and monitoring, and
measuring the ROI of IT.
Power and Cooling remain the top challenges to IT managers as
digitalisation increases around the world and extends to fi nance,
healthcare, industry and hospitals. Outsourcing of IT services is
fueling the growth in colocation facilities and cloud computing. Energy
effi ciency of IT has also come to the attention of many governments,
resulting in recommended standards and legal regulations.
According to Gartner (September 2010) “Leading-edge data centres
today generally need three things: the ability to support high-density
growth, the ability to support both the scaling out and scaling up of
IT resources, depending on the needs of the business, and a design
that accomplishes this in the most energy-effi cient manner possible.”
Schneider Electric’s unique data centre solutions deliver on these
three imperatives and guarantee customers a 30% reduction in
energy consumption.
Schneider Electric solutions covers up to 60% of the total spend
in the data centre including power, cooling, racks, software
management, security and services.
2010 REGISTRATION DOCUMENT SCHNEIDER ELECTRIC 141