Cabela's 2006 Annual Report Download - page 29
Download and view the complete annual report
Please find page 29 of the 2006 Cabela's annual report below. You can navigate through the pages in the report by either clicking on the pages listed below, or by using the keyword search tool below to find specific information within the annual report.-
 1
1 -
2
-
3
-
4
-
5
-
6
-
7
-
8
-
9
-
10
-
11
-
12
-
13
-
14
-
15
-
16
-
17
-
18
-
 19
19 -
 20
20 -
 21
21 -
 22
22 -
 23
23 -
 24
24 -
 25
25 -
 26
26 -
 27
27 -
 28
28 -
 29
29 -
 30
30 -
 31
31 -
 32
32 -
 33
33 -
 34
34 -
 35
35 -
 36
36 -
 37
37 -
 38
38 -
 39
39 -
40
-
41
-
42
-
43
-
44
-
45
-
46
-
47
-
48
-
49
-
50
-
51
-
52
-
53
-
54
-
55
-
56
-
57
-
58
-
59
-
60
-
61
-
62
-
63
-
64
-
65
-
66
-
67
-
68
-
69
-
70
-
71
-
72
-
73
-
74
-
75
-
76
-
77
-
78
-
79
-
80
-
81
-
82
-
83
-
84
-
85
-
86
-
87
-
88
-
89
-
90
-
91
-
92
-
93
-
94
-
95
-
96
-
97
-
98
-
99
-
100
-
101
-
102
-
103
-
104
-
105
-
106
-
107
-
108
-
109
-
110
-
111
-
112
-
113
-
114
 |
 |

25
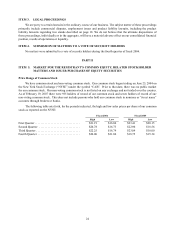
Stock Performance Graph
The following stock performance graph and table show Cabela’s cumulative total shareholder return on a
quarterly basis since the beginning of our first full fiscal quarter following the date of our initial public offering. The
graph also shows the cumulative total returns of the S&P 500 Retailing Index and the S&P 500 Index. The graph
assumes that $100 was invested on July 2, 2004.
-
20
40
60
80
100
120
$140
7/2/04 10/1/04 12/31/04 4/1/05 7/1/05 9/30/05 12/30/05 3/31/06 6/30/06 9/29/06 12/29/06
Cabela's Inc. S&P 500 Retailing Index S&P 500 Index
Market closing price at closest date to end of Cabela’s fiscal quarter:
July 2,
2004
Oct. 1,
2004
Dec. 31,
2004
Apr. 1,
2005
July 1,
2005
Sept. 30,
2005
Dec. 30,
2005
Mar. 31,
2006
June 30,
2006
Sept. 29,
2006
Dec. 29,
2006
Cabela’s Inc. . . . . . . . $100.00 $ 87.77 $ 84.54 $ 76.06 $ 78.44 $ 68.29 $ 61.71 $ 76.28 $ 71.60 $ 80.78 $ 89.70
S&P 500
Retailing Index . . 100.00 103.61 116.56 106.98 111.36 110.56 115.17 119.49 113.91 118.77 125.95
S&P 500 Index . . . . . 100.00 100.54 107.69 104.22 106.14 109.19 110.92 115.06 112.87 118.70 126.03
Dividend Policy
We have never declared or paid any cash dividends on our common stock and do not anticipate paying any cash
dividends on our common stock in the foreseeable future. In addition, our revolving credit facility and our senior
notes restrict our ability to pay dividends to our stockholders based upon our prior year’s consolidated EBITDA
and our consolidated net worth, respectively. See “Management’s Discussion and Analysis of Financial Condition
and Results of Operations – Liquidity and Capital Resources – Credit Facilities and Other Indebtedness” regarding
dividend restrictions and defining EBITDA.
Equity Compensation Plans
For information on securities authorized for issuance under our equity compensation plans, see “Item 12 –
Security Ownership of Certain Beneficial Owners and Management and Related Stockholder Matters.”