Cabela's 2006 Annual Report Download - page 43
Download and view the complete annual report
Please find page 43 of the 2006 Cabela's annual report below. You can navigate through the pages in the report by either clicking on the pages listed below, or by using the keyword search tool below to find specific information within the annual report.-
 1
1 -
2
-
3
-
4
-
5
-
6
-
7
-
8
-
9
-
10
-
11
-
12
-
13
-
14
-
15
-
16
-
17
-
18
-
19
-
20
-
21
-
22
-
23
-
24
-
25
-
26
-
27
-
28
-
29
-
30
-
31
-
32
-
 33
33 -
 34
34 -
 35
35 -
 36
36 -
 37
37 -
 38
38 -
 39
39 -
 40
40 -
 41
41 -
 42
42 -
 43
43 -
 44
44 -
 45
45 -
 46
46 -
 47
47 -
 48
48 -
 49
49 -
 50
50 -
 51
51 -
 52
52 -
 53
53 -
54
-
55
-
56
-
57
-
58
-
59
-
60
-
61
-
62
-
63
-
64
-
65
-
66
-
67
-
68
-
69
-
70
-
71
-
72
-
73
-
74
-
75
-
76
-
77
-
78
-
79
-
80
-
81
-
82
-
83
-
84
-
85
-
86
-
87
-
88
-
89
-
90
-
91
-
92
-
93
-
94
-
95
-
96
-
97
-
98
-
99
-
100
-
101
-
102
-
103
-
104
-
105
-
106
-
107
-
108
-
109
-
110
-
111
-
112
-
113
-
114
 |
 |
39
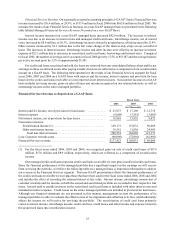
Financial Services Revenue. Financial Services revenue increased by $36.8 million, or 53.3%, to $105.8 million
in fiscal 2005. We measure the results of our Financial Services business on a non-GAAP managed basis as presented
in the table on page 36. Interest income measured on a managed basis increased $31.5 million. The increase in
interest income was due to an increase in interest rates and managed credit card loans. Interchange income, net of
reward costs, increased by $15.0 million, or 54.7%. Interchange income is driven by net purchases, which increased
by 22.2%. In addition, our participation in a new reward program with Visa increased our interchange income
by $5.7 million for the fiscal year. Customer reward costs, which are netted against Financial Services revenue,
generally increase at the same rate as Visa net purchases. However, in fiscal 2005, customer reward costs increased
only $11.0 million, or 17.8% over fiscal 2004. The decrease in the growth rate of customer reward costs as compared
to Visa net purchases was caused by changes in some of our promotional event campaigns and the implementation of
the instant credit program in our destination retail stores in the second fiscal quarter of 2005. Instant credit allows
customers to find out within minutes if they are approved for credit. Changes in our customer rewards program
implemented in connection with instant credit have reduced the customer rewards costs related to the acquisition of
new accounts. Other income increased by $5.3 million due to the fair value change of the interest-only strips on the
securitized loans. The increases in interest income, interchange income and other income were offset by an increase
in interest expense of $14.9 million due to increases in securitized credit card loans, borrowings and interest rates.
Compared to fiscal 2004, the number of average active accounts in fiscal 2005 grew by 17.3% to 726,214 and the
average balance per active account grew by 5.1% to approximately $1,509.
Gross Profit
Gross profit increased by $105.0 million, or 16.7%, to $735.3 million in fiscal 2005 from $630.3 million in
fiscal 2004. As a percentage of revenue, gross profit increased to 40.9% for fiscal 2005, compared to 40.5% in fiscal
2004. Our Financial Services revenue growth of $36.8 million, for which there is no corresponding increase in cost
of revenue, provided for an increase of 0.9% to gross profit as a percent of revenue. However, this was offset by a
decline in merchandising gross profit of 0.4% of merchandise revenue, as discussed below, and a decline of 0.1% in
gross profit as a percent of revenue on our other revenue due to sales of land at relatively low gross profit.
Merchandising Business. The gross profit of our merchandising business increased by $64.0 million, or 11.5%,
to $620.2 million in fiscal 2005 from $556.2 million in fiscal 2004. As a percentage of merchandise revenue,
gross profit declined by 0.4% to 37.3% in fiscal 2005 from 37.7% in fiscal 2004. The decline was attributable to
increased freight costs due to higher fuel prices. Freight costs increased by 0.6% of merchandise revenue to 2.9%
of merchandise revenue in fiscal 2005 compared to 2.3% of merchandise revenue in fiscal 2004. Declines in gross
profit due to freight costs were offset by improved merchandising practices and less discounting as a percentage of
merchandise revenue over the prior year.