Cabela's 2006 Annual Report Download - page 94
Download and view the complete annual report
Please find page 94 of the 2006 Cabela's annual report below. You can navigate through the pages in the report by either clicking on the pages listed below, or by using the keyword search tool below to find specific information within the annual report.-
 1
1 -
2
-
3
-
4
-
5
-
6
-
7
-
8
-
9
-
10
-
11
-
12
-
13
-
14
-
15
-
16
-
17
-
18
-
19
-
20
-
21
-
22
-
23
-
24
-
25
-
26
-
27
-
28
-
29
-
30
-
31
-
32
-
33
-
34
-
35
-
36
-
37
-
38
-
39
-
40
-
41
-
42
-
43
-
44
-
45
-
46
-
47
-
48
-
49
-
50
-
51
-
52
-
53
-
54
-
55
-
56
-
57
-
58
-
59
-
60
-
61
-
62
-
63
-
64
-
65
-
66
-
67
-
68
-
69
-
70
-
71
-
72
-
73
-
74
-
75
-
76
-
77
-
78
-
79
-
80
-
81
-
82
-
83
-
 84
84 -
 85
85 -
 86
86 -
 87
87 -
 88
88 -
 89
89 -
 90
90 -
 91
91 -
 92
92 -
 93
93 -
 94
94 -
 95
95 -
 96
96 -
 97
97 -
 98
98 -
 99
99 -
 100
100 -
 101
101 -
 102
102 -
 103
103 -
 104
104 -
105
-
106
-
107
-
108
-
109
-
110
-
111
-
112
-
113
-
114
 |
 |

90
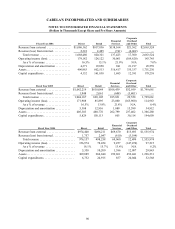
CABELA’S INCORPORATED AND SUBSIDIARIES
NOTES TO CONSOLIDATED FINANCIAL STATEMENTS
(Dollars in Thousands Except Share and Per Share Amounts)
Fiscal Year 2006 Direct Retail
Financial
Services
Corporate
Overhead
and Other Total
Revenue from external . . . . . . . . . . . . . . . . $1,086,162 $817,836 $138,164 $21,362 $2,063,524
Revenue (loss) from internal . . . . . . . . . . . . 2,318 2,485 (741) (4,062) —
Total revenue . . . . . . . . . . . . . . . . . . . . . 1,088,480 820,321 137,423 17,300 2,063,524
Operating income (loss). . . . . . . . . . . . . . . . 179,182 124,122 30,061 (189,620) 143,745
As a % of revenue . . . . . . . . . . . . . . . . . 16.5% 15.1% 21.9% N/A 7.0%
Depreciation and amortization . . . . . . . . . . 4,371 19,050 941 21,197 45,559
Assets. . . . . . . . . . . . . . . . . . . . . . . . . . . . . . 496,963 602,513 316,417 335,337 1,751,230
Capital expenditures . . . . . . . . . . . . . . . . . . 4,132 161,030 1,685 12,391 179,238
Fiscal Year 2005 Direct Retail
Financial
Services
Corporate
Overhead
and Other Total
Revenue from external . . . . . . . . . . . . . . . . $1,042,219 $618,044 $106,439 $32,959 $1,799,661
Revenue (loss) from internal . . . . . . . . . . . . 1,948 2,061 (608) (3,401) —
Total revenue . . . . . . . . . . . . . . . . . . . . . 1,044,167 620,105 105,831 29,558 1,799,661
Operating income (loss). . . . . . . . . . . . . . . . 171,908 85,895 23,060 (165,900) 114,963
As a % of revenue . . . . . . . . . . . . . . . . . 16.5% 13.9% 21.8% N/A 6.4%
Depreciation and amortization . . . . . . . . . . 5,308 12,916 1,089 15,599 34,912
Assets. . . . . . . . . . . . . . . . . . . . . . . . . . . . . . 405,303 460,776 262,799 237,402 1,366,280
Capital expenditures . . . . . . . . . . . . . . . . . . 5,829 158,113 603 30,114 194,659
Fiscal Year 2004 Direct Retail
Financial
Services
Corporate
Overhead
and Other Total
Revenue from external . . . . . . . . . . . . . . . . . . . $974,400 $496,211 $69,670 $15,693 $1,555,974
Revenue (loss) from internal . . . . . . . . . . . . . . . 1,757 2,047 (610) (3,194) —
Total revenue . . . . . . . . . . . . . . . . . . . . . . . . 976,157 498,258 69,060 12,499 1,555,974
Operating income (loss). . . . . . . . . . . . . . . . . . . 156,974 78,454 9,257 (147,470) 97,215
As a % of revenue . . . . . . . . . . . . . . . . . . . . 16.1% 15.7% 13.4% N/A 6.2%
Depreciation and amortization . . . . . . . . . . . . . 5,350 10,200 1,386 12,907 29,843
Assets. . . . . . . . . . . . . . . . . . . . . . . . . . . . . . . . . 309,089 266,840 199,861 452,441 1,228,231
Capital expenditures . . . . . . . . . . . . . . . . . . . . . 6,752 24,915 857 20,044 52,568