Cabela's 2006 Annual Report Download - page 95
Download and view the complete annual report
Please find page 95 of the 2006 Cabela's annual report below. You can navigate through the pages in the report by either clicking on the pages listed below, or by using the keyword search tool below to find specific information within the annual report.-
 1
1 -
2
-
3
-
4
-
5
-
6
-
7
-
8
-
9
-
10
-
11
-
12
-
13
-
14
-
15
-
16
-
17
-
18
-
19
-
20
-
21
-
22
-
23
-
24
-
25
-
26
-
27
-
28
-
29
-
30
-
31
-
32
-
33
-
34
-
35
-
36
-
37
-
38
-
39
-
40
-
41
-
42
-
43
-
44
-
45
-
46
-
47
-
48
-
49
-
50
-
51
-
52
-
53
-
54
-
55
-
56
-
57
-
58
-
59
-
60
-
61
-
62
-
63
-
64
-
65
-
66
-
67
-
68
-
69
-
70
-
71
-
72
-
73
-
74
-
75
-
76
-
77
-
78
-
79
-
80
-
81
-
82
-
83
-
84
-
 85
85 -
 86
86 -
 87
87 -
 88
88 -
 89
89 -
 90
90 -
 91
91 -
 92
92 -
 93
93 -
 94
94 -
 95
95 -
 96
96 -
 97
97 -
 98
98 -
 99
99 -
 100
100 -
 101
101 -
 102
102 -
 103
103 -
 104
104 -
 105
105 -
106
-
107
-
108
-
109
-
110
-
111
-
112
-
113
-
114
 |
 |

91
CABELA’S INCORPORATED AND SUBSIDIARIES
NOTES TO CONSOLIDATED FINANCIAL STATEMENTS
(Dollars in Thousands Except Share and Per Share Amounts)
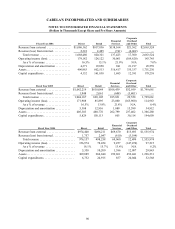
The components and amounts of total revenue for the Financial Services business segment were as follows for
the fiscal years ended:
2006 2005 2004
Interest and fee income, net of provision for loan losses . . . . . . . . . . . . . . . . $ 23,973 $ 17,196 $12,735
Interest expense................................................ (5,008) (3,241) (3,063)
Net interest income, net of provision for loan losses . . . . . . . . . . . . . . . . . . . 18,965 13,955 9,672
Non-interest income:
Securitization income. . . . . . . . . . . . . . . . . . . . . . . . . . . . . . . . . . . . . . . . . 169,173 133,032 96,466
Other non-interest income . . . . . . . . . . . . . . . . . . . . . . . . . . . . . . . . . . . . . 39,381 31,836 24,905
Total non-interest income . . . . . . . . . . . . . . . . . . . . . . . . . . . . . . . . . . . 208,554 164,868 121,371
Less: Customer rewards costs . . . . . . . . . . . . . . . . . . . . . . . . . . . . . . . . . . (90,096) (72,992) (61,983)
Financial Services Total Revenue .................................. $137,423 $105,831 $69,060
The Company’s products are principally marketed to individuals within the United States. Net sales realized from
other geographic markets, primarily Canada, have collectively been less than 2% of consolidated net merchandise
sales in each reported period. No single customer accounted for ten percent or more of consolidated net sales. No
single product or service accounts for a significant percentage of the Company’s consolidated revenue.