Cabela's 2006 Annual Report Download - page 30
Download and view the complete annual report
Please find page 30 of the 2006 Cabela's annual report below. You can navigate through the pages in the report by either clicking on the pages listed below, or by using the keyword search tool below to find specific information within the annual report.-
 1
1 -
2
-
3
-
4
-
5
-
6
-
7
-
8
-
9
-
10
-
11
-
12
-
13
-
14
-
15
-
16
-
17
-
18
-
19
-
 20
20 -
 21
21 -
 22
22 -
 23
23 -
 24
24 -
 25
25 -
 26
26 -
 27
27 -
 28
28 -
 29
29 -
 30
30 -
 31
31 -
 32
32 -
 33
33 -
 34
34 -
 35
35 -
 36
36 -
 37
37 -
 38
38 -
 39
39 -
 40
40 -
41
-
42
-
43
-
44
-
45
-
46
-
47
-
48
-
49
-
50
-
51
-
52
-
53
-
54
-
55
-
56
-
57
-
58
-
59
-
60
-
61
-
62
-
63
-
64
-
65
-
66
-
67
-
68
-
69
-
70
-
71
-
72
-
73
-
74
-
75
-
76
-
77
-
78
-
79
-
80
-
81
-
82
-
83
-
84
-
85
-
86
-
87
-
88
-
89
-
90
-
91
-
92
-
93
-
94
-
95
-
96
-
97
-
98
-
99
-
100
-
101
-
102
-
103
-
104
-
105
-
106
-
107
-
108
-
109
-
110
-
111
-
112
-
113
-
114
 |
 |

26
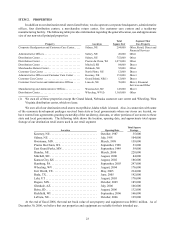
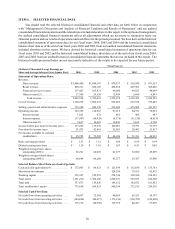
ITEM 6. SELECTED FINANCIAL DATA
You should read the selected historical consolidated financial and other data set forth below in conjunction
with “Management’s Discussion and Analysis of Financial Condition and Results of Operations” and our audited
consolidated financial statements and the related notes included elsewhere in this report. In the opinion of management,
the audited consolidated financial statements reflect all adjustments which are necessary to summarize fairly our
financial position and our results of operations and cash flows for the periods presented. We have derived the historical
consolidated statement of operations data for our fiscal years 2006, 2005 and 2004 and the historical consolidated
balance sheet data as of the end of our fiscal years 2006 and 2005 from our audited consolidated financial statements
included elsewhere in this report. We have derived the historical consolidated statement of operations data for our
fiscal years 2003 and 2002 and the historical consolidated balance sheet data as of the end of our fiscal years 2004,
2003 and 2002 from our audited historical consolidated financial statements that are not included in this report. The
historical results presented below are not necessarily indicative of the results to be expected for any future period.
Fiscal Year (1)
(Dollars in Thousands Except Earnings per
Share and Average Sales per Gross Square Foot) 2006 2005 2004 2003 2002
Statement of Operations Data:
Revenue:
Direct revenue . . . . . . . . . . . . . . . . . . . . . . . $1,088,480 $1,044,167 $ 976,157 $ 928,949 $ 871,553
Retail revenue . . . . . . . . . . . . . . . . . . . . . . . 820,321 620,105 498,258 407,961 305,486
Financial services revenue. . . . . . . . . . . . . . 137,423 105,831 69,060 49,823 40,699
Other revenue (2). . . . . . . . . . . . . . . . . . . . . 17,300 29,558 12,499 5,690 6,843
Total revenue . . . . . . . . . . . . . . . . . . . . . 2,063,524 1,799,661 1,555,974 1,392,423 1,224,581
Cost of revenue . . . . . . . . . . . . . . . . . . . . . . . . . 1,204,399 1,064,322 925,665 827,528 735,445
Selling, general and administrative expenses 715,380 620,376 533,094 479,964 413,135
Operating income . . . . . . . . . . . . . . . . . . . . . . . 143,745 114,963 97,215 84,931 76,001
Interest income . . . . . . . . . . . . . . . . . . . . . . 1,821 672 601 408 443
Interest expense . . . . . . . . . . . . . . . . . . . . . . (17,947) (10,928) (8,178) (11,158) (8,413)
Other income (3) . . . . . . . . . . . . . . . . . . . . . 9,637 10,663 10,443 5,612 4,708
Income before provision for income taxes . . . . 137,256 115,370 100,081 79,793 72,739
Provision for income taxes . . . . . . . . . . . . . . . 51,471 42,801 35,085 28,402 25,817
Net income available to common
stockholders . . . . . . . . . . . . . . . . . . . . . . . . $ 85,785 $ 72,569 $ 64,996 $ 51,391 $ 46,922
Basic earnings per share . . . . . . . . . . . . . . . . . $ 1.32 $ 1.12 $ 1.06 $ 0.99 $ 0.94
Diluted earnings per share . . . . . . . . . . . . . . . $ 1.29 $ 1.10 $ 1.03 $ 0.93 $ 0.88
Weighted average basic shares
outstanding (000’s) . . . . . . . . . . . . . . . . . . 65,221 64,669 61,277 52,060 49,899
Weighted average diluted shares
outstanding (000’s) . . . . . . . . . . . . . . . . . . 66,644 66,268 63,277 55,307 53,400
Selected Balance Sheet Data (as of end of period):
Cash and cash equivalents (4) . . . . . . . . . . . . . $ 172,903 $ 86,923 $ 123,934 $ 112,656 $ 135,761
Short-term investments . . . . . . . . . . . . . . . . . . — — 124,250 79,925 42,875
Working capital . . . . . . . . . . . . . . . . . . . . . . . . 335,387 145,559 274,746 228,580 188,229
Total assets . . . . . . . . . . . . . . . . . . . . . . . . . . . . 1,751,230 1,366,280 1,228,231 963,553 834,968
Total debt . . . . . . . . . . . . . . . . . . . . . . . . . . . . . 317,873 119,826 148,152 142,651 161,452
Total stockholders’ equity . . . . . . . . . . . . . . . . 733,858 639,853 566,354 372,515 259,530
Selected Cash Flow Data:
Net cash flows from operating activities . . . . 54,957 72,564 46,659 63,253 54,797
Net cash flows from investing activities . . . . . (144,696) (80,617) (171,136) (126,785) (126,490)
Net cash flows from financing activities . . . . 175,719 (28,958) 135,755 40,427 97,699