Cabela's 2006 Annual Report Download - page 38
Download and view the complete annual report
Please find page 38 of the 2006 Cabela's annual report below. You can navigate through the pages in the report by either clicking on the pages listed below, or by using the keyword search tool below to find specific information within the annual report.-
 1
1 -
2
-
3
-
4
-
5
-
6
-
7
-
8
-
9
-
10
-
11
-
12
-
13
-
14
-
15
-
16
-
17
-
18
-
19
-
20
-
21
-
22
-
23
-
24
-
25
-
26
-
27
-
 28
28 -
 29
29 -
 30
30 -
 31
31 -
 32
32 -
 33
33 -
 34
34 -
 35
35 -
 36
36 -
 37
37 -
 38
38 -
 39
39 -
 40
40 -
 41
41 -
 42
42 -
 43
43 -
 44
44 -
 45
45 -
 46
46 -
 47
47 -
 48
48 -
49
-
50
-
51
-
52
-
53
-
54
-
55
-
56
-
57
-
58
-
59
-
60
-
61
-
62
-
63
-
64
-
65
-
66
-
67
-
68
-
69
-
70
-
71
-
72
-
73
-
74
-
75
-
76
-
77
-
78
-
79
-
80
-
81
-
82
-
83
-
84
-
85
-
86
-
87
-
88
-
89
-
90
-
91
-
92
-
93
-
94
-
95
-
96
-
97
-
98
-
99
-
100
-
101
-
102
-
103
-
104
-
105
-
106
-
107
-
108
-
109
-
110
-
111
-
112
-
113
-
114
 |
 |

34
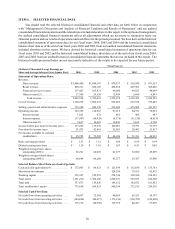
Segment Information
The following table sets forth the revenue and operating income of each of our segments for fiscal years 2006,
2005 and 2004.
Fiscal Years
2006 2005 2004
(Dollars in Thousands)
Direct revenue . . . . . . . . . . . . . . . . . . . . . . . . . . . . . . . . . . . . . . . . $ 1,088,480 $ 1,044,167 $ 976,157
Retail revenue ........................................ 820,321 620,105 498,258
Financial services revenue . . . . . . . . . . . . . . . . . . . . . . . . . . . . . . 137,423 105,831 69,060
Other revenue . . . . . . . . . . . . . . . . . . . . . . . . . . . . . . . . . . . . . . . . 17,300 29,558 12,499
Total revenue . . . . . . . . . . . . . . . . . . . . . . . . . . . . . . . . . . . . . . $ 2,063,524 $1,799,661 $ 1,555,974
Direct operating income . . . . . . . . . . . . . . . . . . . . . . . . . . . . . . . . $ 179,182 $ 171,908 $ 156,974
Retail operating income ................................ 124,122 85,895 78,454
Financial services operating income . . . . . . . . . . . . . . . . . . . . . . 30,061 23,060 9,257
Other operating income (loss) . . . . . . . . . . . . . . . . . . . . . . . . . . . (189,620 ) (165,900 ) (147,470 )
Total operating income . . . . . . . . . . . . . . . . . . . . . . . . . . . . . . $ 143,745 $ 114,963 $ 97,215
As a Percentage of Total Revenue:
Direct revenue ........................................ 52.7% 58.0% 62.7%
Retail revenue ........................................ 39.8 34.5 32.0
Financial services revenue . . . . . . . . . . . . . . . . . . . . . . . . . . . . . . 6.7 5.9 4.4
Other revenue ........................................ 0.8 1.6 0.9
Total revenue . . . . . . . . . . . . . . . . . . . . . . . . . . . . . . . . . . . . . . 100.0% 100.0 % 100.0 %
As a Percentage of Segment Revenue:
Direct operating income . . . . . . . . . . . . . . . . . . . . . . . . . . . . . . . . 16.5% 16.5% 16.1%
Retail operating income ................................ 15.1% 13.9% 15.7%
Financial services operating income . . . . . . . . . . . . . . . . . . . . . . 21.9% 21.8% 13.4%
Total operating income (1) . . . . . . . . . . . . . . . . . . . . . . . . . . . 7.0% 6.4% 6.2%
(1) The percentage of total operating income is a percentage of total consolidated revenue.
Fiscal Year 2006 Compared to Fiscal Year 2005
Revenue
Revenue increased by $263.8 million, or 14.7%, to $2,063.5 million in fiscal 2006 from $1,799.7 million in
fiscal 2005 as we experienced revenue growth in our three major segments. Our land sales decreased in fiscal 2006
as compared to fiscal 2005, which was the primary contributor to the revenue decline in our Other segment of $12.3
million.
Direct Revenue. Direct revenue increased by $44.3 million, or 4.2%, to $1,088.5 million in fiscal 2006 from
$1,044.2 million in fiscal 2005 primarily due to growth in sales through our website. Circulation of our catalogs
increased by 1.6 billion pages, or 4.5%, to 36.8 billion pages in fiscal 2006 from 35.2 billion pages in fiscal 2005.
The number of active customers, which we define as those customers who have purchased merchandise from us in
the last twelve months, increased by 4.6%. The general product category that contributed the largest dollar volume
increase to our fiscal 2006 Direct revenue growth was hunting equipment.
Retail Revenue. Retail revenue increased by $200.2 million, or 32.3%, to $820.3 million in fiscal 2006 from
$620.1 million in fiscal 2005 driven by increased new store sales of $194.4 million. Revenue for stores in our
comparable base increased by $6.7 million, or 1.3%, compared to fiscal 2005. Revenue increases are attributable to
operational improvements in assortment and replenishment as well as increased efforts in advertising. The general
product category that contributed the largest dollar volume increase to our Retail revenue growth in fiscal 2006 was
hunting equipment.