Cabela's 2006 Annual Report Download - page 31
Download and view the complete annual report
Please find page 31 of the 2006 Cabela's annual report below. You can navigate through the pages in the report by either clicking on the pages listed below, or by using the keyword search tool below to find specific information within the annual report.-
 1
1 -
2
-
3
-
4
-
5
-
6
-
7
-
8
-
9
-
10
-
11
-
12
-
13
-
14
-
15
-
16
-
17
-
18
-
19
-
20
-
 21
21 -
 22
22 -
 23
23 -
 24
24 -
 25
25 -
 26
26 -
 27
27 -
 28
28 -
 29
29 -
 30
30 -
 31
31 -
 32
32 -
 33
33 -
 34
34 -
 35
35 -
 36
36 -
 37
37 -
 38
38 -
 39
39 -
 40
40 -
 41
41 -
42
-
43
-
44
-
45
-
46
-
47
-
48
-
49
-
50
-
51
-
52
-
53
-
54
-
55
-
56
-
57
-
58
-
59
-
60
-
61
-
62
-
63
-
64
-
65
-
66
-
67
-
68
-
69
-
70
-
71
-
72
-
73
-
74
-
75
-
76
-
77
-
78
-
79
-
80
-
81
-
82
-
83
-
84
-
85
-
86
-
87
-
88
-
89
-
90
-
91
-
92
-
93
-
94
-
95
-
96
-
97
-
98
-
99
-
100
-
101
-
102
-
103
-
104
-
105
-
106
-
107
-
108
-
109
-
110
-
111
-
112
-
113
-
114
 |
 |

27
Fiscal Year (1)
(Dollars in Thousands Except Earnings per
Share and Average Sales per Gross Square Foot) 2006 2005 2004 2003 2002
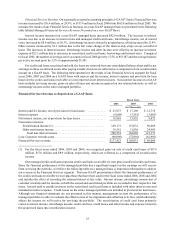
Other Data:
Number of catalogs mailed (000’s) . . . . . . . . . 135,326 121,606 120,383 103,976 96,723
Number of destination retail stores
(at end of period) . . . . . . . . . . . . . . . . . . . . 18 14 10 9 8
Total gross square footage
(at end of the period) . . . . . . . . . . . . . . . . . 2,705,377
2,097,840 1,317,060
1,140,709 893,810
Average sales per gross square foot (5) . . . . . . $ 348 $ 367 $ 399 $ 389 $ 384
Comparable store sales growth (6) . . . . . . . . . . 1.3% (6.2)% (0.8)% 0.6% 3.7%
Depreciation and amortization . . . . . . . . . . . . $ 45,559 $ 34,912 $ 29,843 $ 26,715 $ 23,539
Capital expenditures . . . . . . . . . . . . . . . . . . . . 179,238 194,659 52,568 72,972 53,387
Purchases of marketable securities (7) . . . . . . 23,397 65,077 74,492 18,201 32,821
EBITDA (8) . . . . . . . . . . . . . . . . . . . . . . . . . . . 198,941 160,538 137,501 117,258 104,248
EBITDA margin (9) . . . . . . . . . . . . . . . . . . . . . 9.6% 8.9% 8.8% 8.4% 8.5%
(1) Our fiscal years are based on the 52-53 week period ending on the Saturday closest to December 31. Our fiscal
years 2006, 2005, 2004 and 2002 consisted of 52 weeks and our fiscal year 2003 consisted of 53 weeks.
(2) Other revenue consists primarily of revenue from our real estate and travel businesses.
(3) Other income consists primarily of interest earned on economic development bonds, gains on sales of marketable
securities and equity in undistributed net earnings (losses) of equity method investees.
(4) At fiscal years ended 2006, 2005, 2004, 2003 and 2002, cash and cash equivalents at World’s Foremost Bank
were $52.8 million, $80.6 million, $58.1 million, $77.2 million and $35.0 million, respectively, which is included
in our consolidated cash and cash equivalents. Due to regulatory restrictions, our ability to use this cash for
non-banking operations, including for working capital for our direct or retail businesses or for destination
retail store expansion, may be limited. See “Management’s Discussion and Analysis of Financial Condition
and Results of Operation – Bank Dividend Limitations and Minimum Capital Requirements” for additional
information.
(5) Average sales per gross square foot includes sales and square footage of stores that are open at the beginning of
the period and at the end of the period.
(6) A store is included in our comparable store sales base the first day of the month following the fifteen month
anniversary of its opening or expansion by greater than 25% of total square footage. The percentages shown
are based on a 52 to 52 week comparison.
(7) This amount consists primarily of purchases of economic development bonds, the proceeds of which are used to
construct our destination retail stores and related infrastructure. See “Management’s Discussion and Analysis
of Financial Condition and Results of Operations – Liquidity and Capital Resources – Retail Store Expansion”
for additional information.
(8) When we use the term “EBITDA,” we are referring to net income minus interest income, plus (i) interest
expense, (ii) income taxes and (iii) depreciation and amortization, all as presented in the consolidated statements
of income. Interest income and interest expense of WFB are not adjusted in calculating EBITDA as these
amounts are included in financial services revenue in the consolidated statements of income. We present
EBITDA because we consider it an important supplemental measure of our performance. We also use EBITDA
to determine our compliance with some of the covenants under our revolving credit facility.
EBITDA has limitations as an analytical tool and you should not consider it in isolation or as a substitute for
net income, operating income, cash flows from operating, investing or financing activities or any other measure
calculated in accordance with generally accepted accounting principles. Some of these limitations are:
• EBITDA does not reflect our cash expenditures or future requirements for capital expenditures or capital
commitments;