Cabela's 2006 Annual Report Download - page 40
Download and view the complete annual report
Please find page 40 of the 2006 Cabela's annual report below. You can navigate through the pages in the report by either clicking on the pages listed below, or by using the keyword search tool below to find specific information within the annual report.-
 1
1 -
2
-
3
-
4
-
5
-
6
-
7
-
8
-
9
-
10
-
11
-
12
-
13
-
14
-
15
-
16
-
17
-
18
-
19
-
20
-
21
-
22
-
23
-
24
-
25
-
26
-
27
-
28
-
29
-
 30
30 -
 31
31 -
 32
32 -
 33
33 -
 34
34 -
 35
35 -
 36
36 -
 37
37 -
 38
38 -
 39
39 -
 40
40 -
 41
41 -
 42
42 -
 43
43 -
 44
44 -
 45
45 -
 46
46 -
 47
47 -
 48
48 -
 49
49 -
 50
50 -
51
-
52
-
53
-
54
-
55
-
56
-
57
-
58
-
59
-
60
-
61
-
62
-
63
-
64
-
65
-
66
-
67
-
68
-
69
-
70
-
71
-
72
-
73
-
74
-
75
-
76
-
77
-
78
-
79
-
80
-
81
-
82
-
83
-
84
-
85
-
86
-
87
-
88
-
89
-
90
-
91
-
92
-
93
-
94
-
95
-
96
-
97
-
98
-
99
-
100
-
101
-
102
-
103
-
104
-
105
-
106
-
107
-
108
-
109
-
110
-
111
-
112
-
113
-
114
 |
 |

36
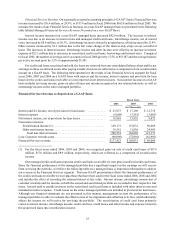
Managed Financial Services Revenue Presented on a non-GAAP Basis:
Fiscal Years
2006 2005 2004
(Dollars in Thousands)
Interest income . . . . . . . . . . . . . . . . . . . . . . . . . . . . . . . . . . . . . . . . $ 145,425 $ 102,824 $ 71,309
Interchange income, net of customer reward costs . . . . . . . . . . . . 51,086 42,468 27,449
Other fee income ...................................... 22,829 20,738 16,841
Interest expense . . . . . . . . . . . . . . . . . . . . . . . . . . . . . . . . . . . . . . . (64,910) (41,654) (26,750 )
Provision for loan losses . . . . . . . . . . . . . . . . . . . . . . . . . . . . . . . . . (26,064 ) (24,254 ) (20,208 )
Other ................................................ 9,057 5,709 419
Managed Financial Services revenue . . . . . . . . . . . . . . . . . . . . . . . $ 137,423 $ 105,831 $ 69,060
As a Percentage of Average Managed Credit Card Loans
Managed Financial Services Revenue:
Interest income ........................................ 10.7% 9.4% 8.0%
Interchange income, net of customer reward costs . . . . . . . . . . . . 3.8 3.9 3.1
Other fee income ...................................... 1.7 1.9 2.0
Interest expense ....................................... (4.8) (3.8) (3.0)
Provision for loan losses . . . . . . . . . . . . . . . . . . . . . . . . . . . . . . . . . (1.9) (2.2) (2.3)
Other ................................................ 0.6 0.5 0.0
Managed Financial Services revenue . . . . . . . . . . . . . . . . . . . . . . . 10.1% 9.7% 7.8%
Average reported credit card loans . . . . . . . . . . . . . . . . . . . . . . . . . $ 133,712 $ 106,115 $ 82,526
Average managed credit card loans . . . . . . . . . . . . . . . . . . . . . . . . $1,357,671 $ 1,095,580 $ 888,730
Gross Profit
Gross profit increased by $123.8 million, or 16.8%, to $859.1 million in fiscal 2006 from $735.3 million in fiscal
2005. As a percentage of revenue, gross profit increased to 41.6% for fiscal 2006 compared to 40.9% for fiscal 2005.
Our Financial Services revenue growth of $31.6 million, which does not have any corresponding increase in cost of
revenue, provided for an increase of 0.5% to gross profit as a percentage of revenue. In our Other segment, sales of
land at higher gross profit margins than the prior year provided for an increase of 0.4% in gross profit as a percentage
of revenue. However, these increases were offset by a decline in merchandising gross profit of 0.2% of merchandise
revenue, as discussed below.
Merchandising Business. The gross profit of our merchandising business increased by $88.8 million, or 14.3%,
to $709.0 million in fiscal 2006 from $620.2 million in fiscal 2005. As a percentage of merchandise revenue, gross
profit declined by 0.2% to 37.1% in fiscal 2006 from 37.3% in fiscal 2005. We saw improvements in our gross margin
due to better merchandising practices, increased sales of our Cabela’s branded merchandise and improvements in
operations, which have reduced our shrink costs and our obsolete inventory levels. These improvements in our gross
margin were largely offset by an increase in sales discounts of 0.7% of merchandise revenue. These discounts were
related to our promotional gift card campaign in our Retail segment and a new promotional campaign in the Direct
business. Our shipping margin – the shipping income we collect less the cost we pay to ship merchandise to our
customers – declined by 0.3% of merchandise revenue. The primary reason for the decline in shipping margin was
caused by the implementation of our new warehouse management software, which caused us to ship more packages
per order due to the inability to transfer products between distribution centers while the software was being phased-
in. That issue was resolved in October 2006.